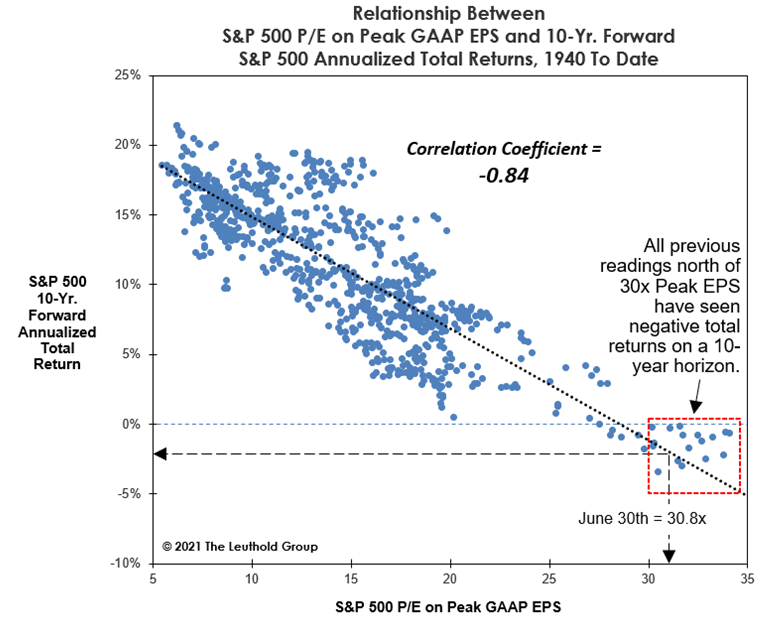
S&P 500's June 2021 peak PE at 30.8 (99th %tile, below Dec 1999's 35.8 an all time record which would put $SPX +5000) such high #valuation corresponds to poor long term returns - a slightly negative 10 year annualized total return!
chart via @LeutholdGroup
Jeremy Grantham of GMO recently spoke with @johnauthers on the same topic with less equivocation: "The last 12 months have been a classic finale to an 11-year bull market"
https://t.co/MMAcArohFI
"The Cleveland Fed model’s r-squared [based on monthly data back to 2003] was highest at 23%, followed by the University of Michigan consumer survey at 20%, and the five-year breakeven inflation rate at 0%."
https://t.co/lHcdoNZS0Q
ICYMI: David Rosenberg @EconguyRosie on the #inflation vs #deflation debate & his recommendation of long 30 year Treasury bond, potential +25% return over 1 year
https://t.co/to85c9BqVY
#Bitcoin, devoid of any fundamentals & inherent value, is as pure a manifestation of the aggregate financial id as we'll ever encounter: chart of Goldman Sachs Risk Appetite metric compared to the price of Bitcoin (YoY).
@f_helou@EconguyRosie You're right, the point Rosenberg is making is that consensus is at an extreme level of crowding and that does typically suggest a contrarian response.
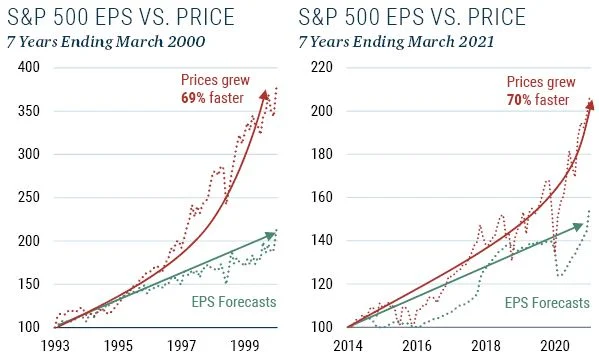
GMO cautions re #valuation by comparing EPS vs prices for 1990's market and today's
EPS forecasts are 2-year forecasts. In the first chart, EPS forecasts grew at an annualized rate of 11.1%; in the second chart, EPS forecasts grew at an annualized rate of 6.4%.
Investors Intelligence weekly #sentiment survey of newsletters shows little change:
bulls 54.5% (up by almost 0.9% pts from last wk)
bears 16.2% (slight decline of 0.3% pts)
correction 29.3%
chart via @WillieDelwiche


![TN's tweet photo. "The Cleveland Fed model’s r-squared [based on monthly data back to 2003] was highest at 23%, followed by the University of Michigan consumer survey at 20%, and the five-year breakeven inflation rate at 0%."
https://t.co/lHcdoNZS0Q https://t.co/EcTfR0XfNL](https://pbs.twimg.com/media/E3ySAfTWQBA4Bom.jpg)