We have been active asset allocators for about four decades. Our outlook is long term, yet we continually evaluate the market's underlying health and make changes as needed.
$LCR Leuthold Core ETF
$LST Select Industries ETF
$LCORX Leuthold Core Fund
https://t.co/60bIrC8f31
“Up” vs “down” earnings in "month 1" of Q1 slipped versus Q4’s comparable figure. It’s still strong vs. the LT average, but the current expansion is getting mature. Historically, expecting the run to prolong seems optimistic—lookbacks will get tougher. #Earnings#Markets
Over 100 yrs of data, $SPY had its worst returns for the current year’s May-Oct combo of election-year/calendar cycles (+1.9% avg). But, historically, the best 6-mo period begins in Nov (+13.7%). The Nov-Apr span is even better for small caps: +20%-plus from the avg. loss posted May-Oct
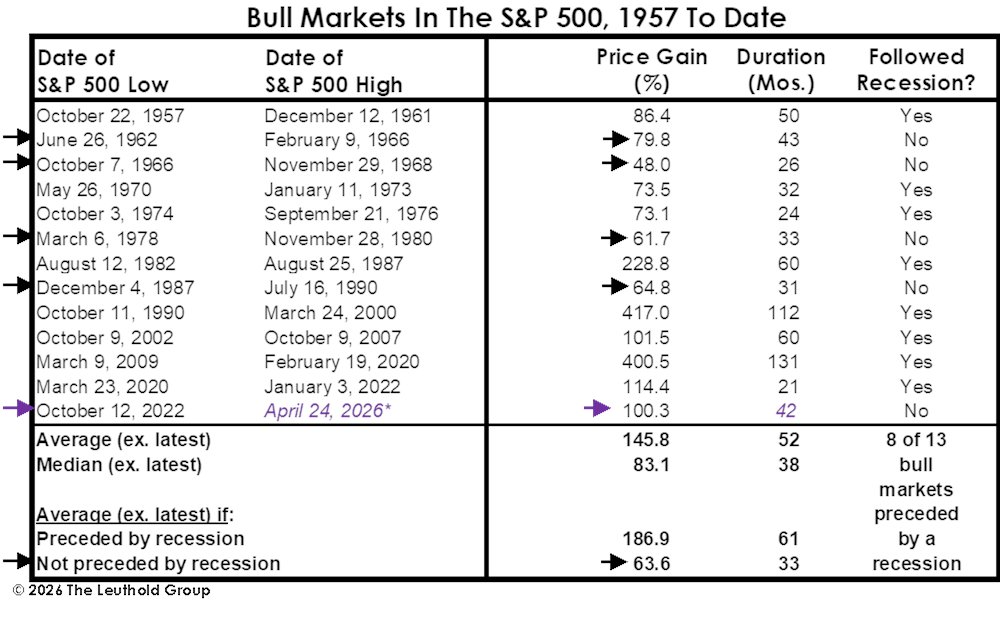
Friday’s S&P 500 all-time high was a major milestone: 100% gain since the bull’s Oct-22 birth. It is horns, head, and shoulders above all others that followed non-recessionary bear markets. If $SPY rises into mid-June, it will be the longest-lived bull born w/o the “benefit” of recession
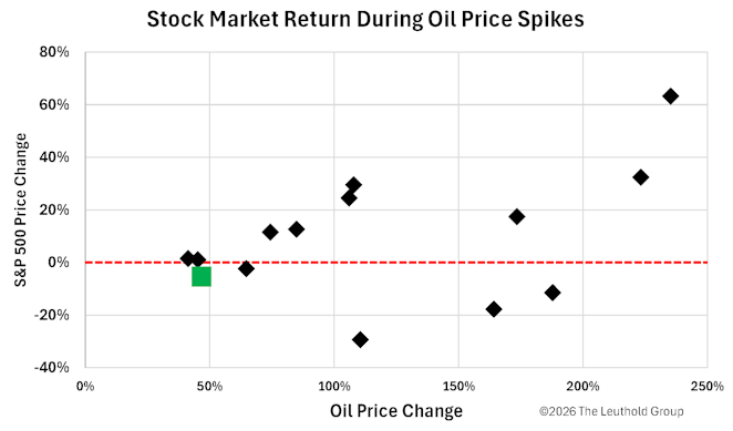
The @LeutholdGroup found that in the 15 oil price spikes they identified, only one coincided with a bear market: 2002.
Average return for the S&P 500 across all periods (whilst oil is spiking) is +10% ... March 2026 is marked by the green square.
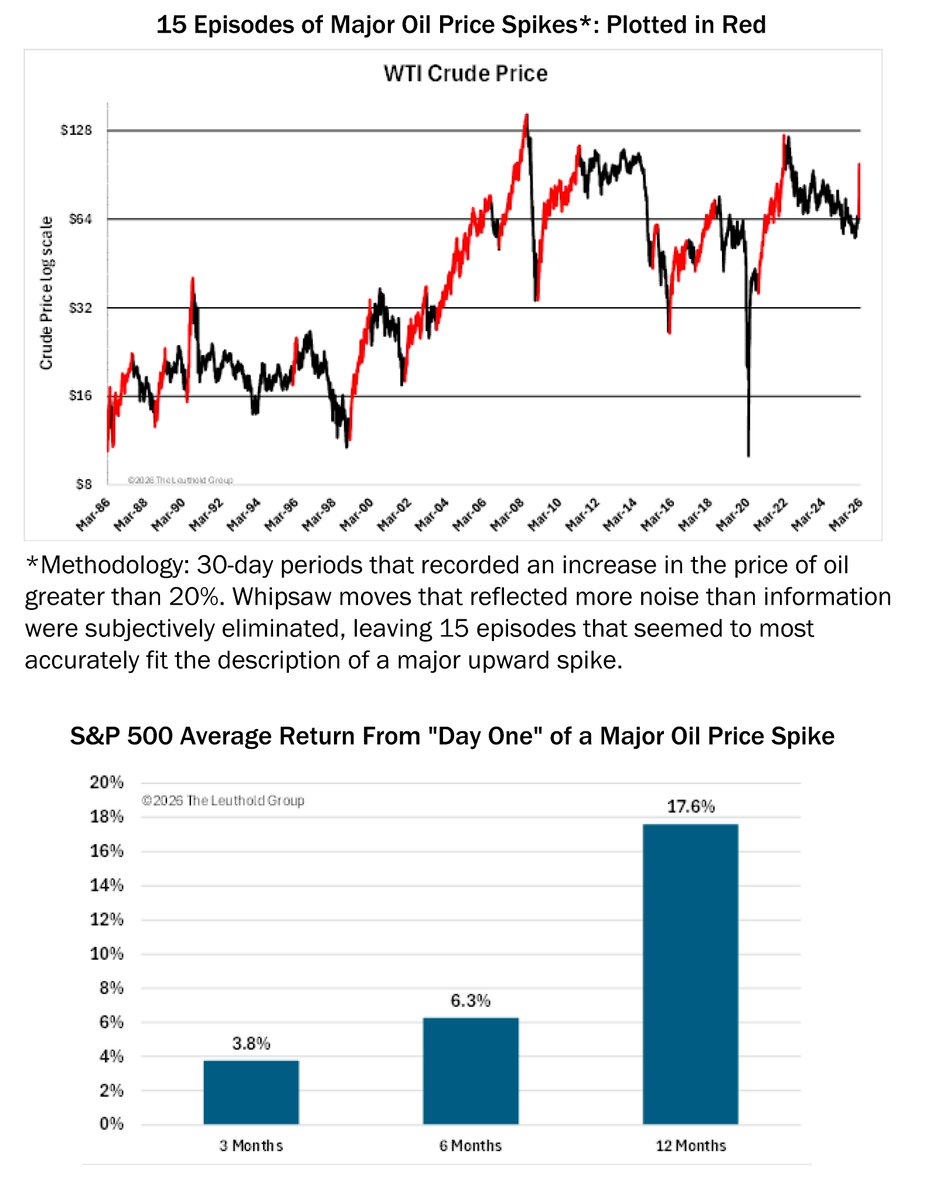
Measured from the first day of a major oil price spike, $SPX forward return for 3-, 6-, and 12-mos are also surprisingly favorable. The 3- and 6-mo periods’ avg. gain was ~1% per month, and an astounding +17.6% over the next year. #Oil $XLE $XOM $CVX $CL_F
The @LeutholdGroup found that in the 15 oil price spikes they identified, only one coincided with a bear market: 2002.
Average return for the S&P 500 across all periods (whilst oil is spiking) is +10% ... March 2026 is marked by the green square.
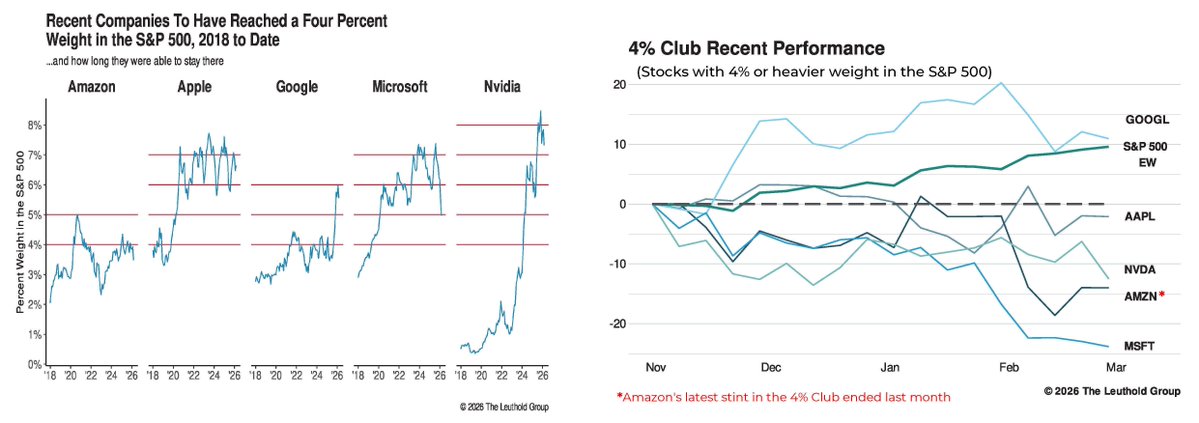
Nvidia’s weight in $SPY has slimmed down from a mind-boggling 8.5% to a still incredible 7.32%. Its streak of nine consecutive months with a heft greater than 7% is matched only by $AAPL 's run-up in 2023. $NVDA #Mag7
It has been rough sledding for our “4% Club” contingent over the last 4 months. Microsoft lost 24%—a $930 billion plunge in mkt cap (roughly one Berkshire Hathaway or three Coca-Colas). $MSFT ended Feb. w/ an $SPY weight of < 5% for the first time since Jan-2020. $BRK $KO
If the #SP500 retreats to a more conventional concentration scheme, it would be a big boost for active investors. Yet, a sharp re-rating of the mega-cap giants, which have generated vast paper wealth and very real spending, could spell disaster for the economy.
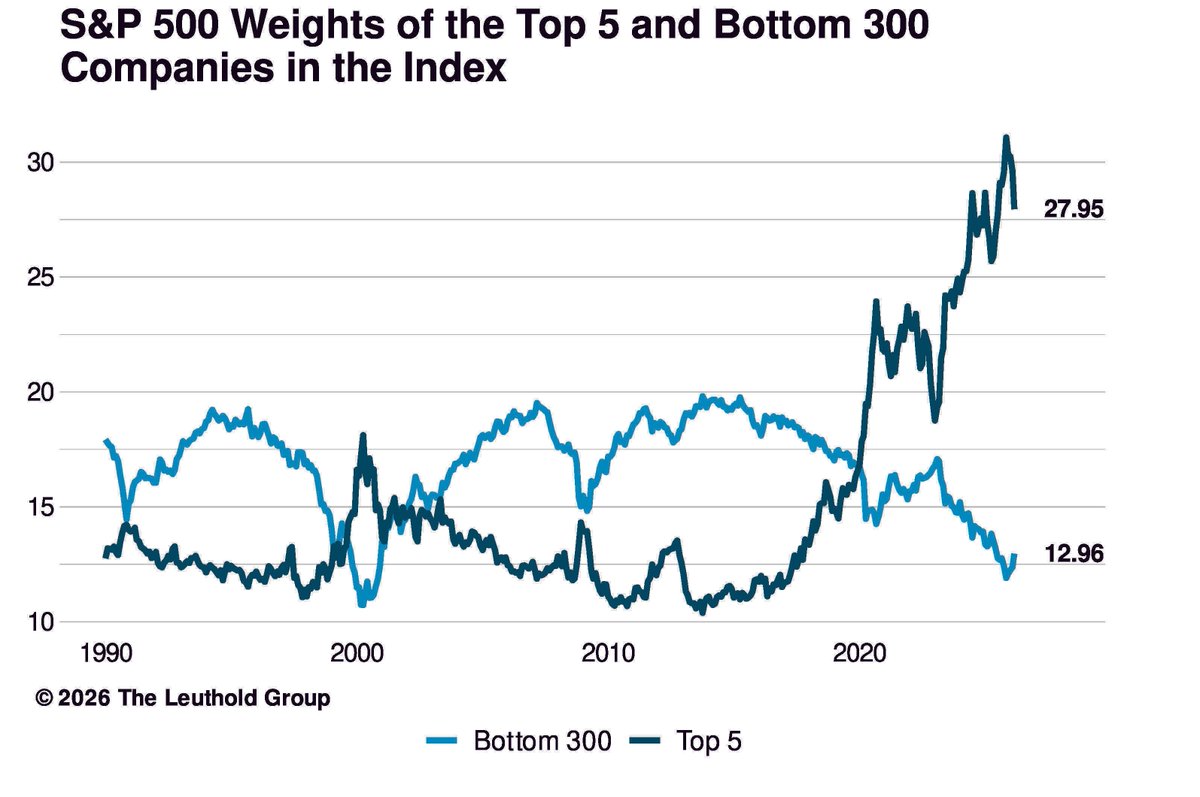
In Feb. $SPY saw its fourth major dip in concentration since the mega-cap Tech surge began. Yet, the top 5 stocks still account for 28% of the index, while the bottom 300 make up 13%. Before 2020, the bottom 60% typically dominated the top 1%. #StockMarket#Investing#Mag7
As far as railroads and trucking companies, Swenson says they suffer from the fact that “their fundamentals are more impaired and valuations look less attractive.” Based on our quantitatively-driven analysis, "deteriorating profitability and negative earnings revisions” make truckers especially unappealing.
Leuthold's Greg Swenson cited by @LaMonicaBuzz@barronsonline “While Transports are often discussed as a single industry, dispersion beneath the surface is elevated.” Dow Transport Index Is Sizzling. Stick With Planes, Not Trucks and Trains. https://t.co/hUgVGTUc93 #paywall (may apply) #DJTransports
Leuthold's Greg Swenson cited by @barronsonline “While Transports are often discussed as a single industry, dispersion beneath the surface is elevated.” Dow Transport Index Is Sizzling. Stick With Planes, Not Trucks and Trains. https://t.co/jsUgQNGxCz #paywall may apply
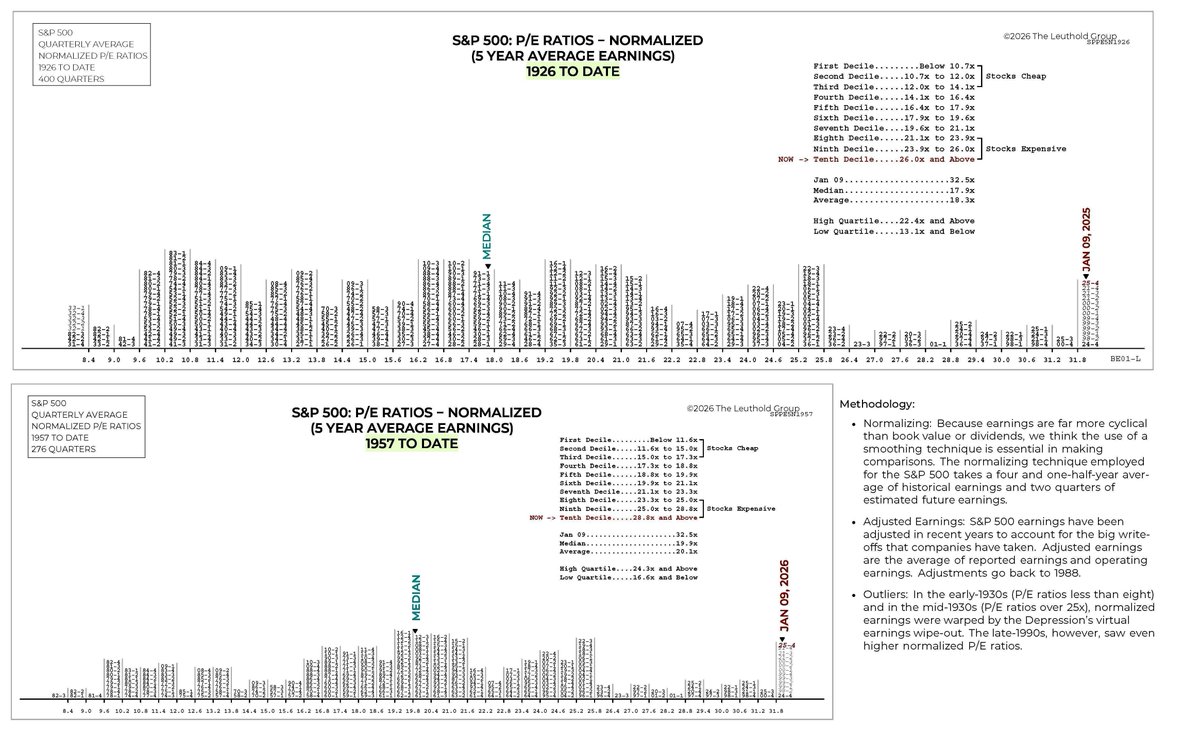
As of 4Q25, S&P 500 Normalized Earnings sit in the 10th decile, marking them among the priciest in history, based on figures from 1926 to date and from 1957 forward. Could this indicate a "new era" or is it unsustainable? $SPY #StockMarket#Investing#Valuations
Equal-Wgt $SPY had best month vs S&P 500 Top-10 Index since March 2025. The avg $SPY stock has outdone the Top 10 for 3 mos running (by 8.5%). If this is the start of a fortune reversal for smalls, there is ample runway. Since 12/31/22: S&P 500 Top 10 +186%; EW SPY +48%. $RSP
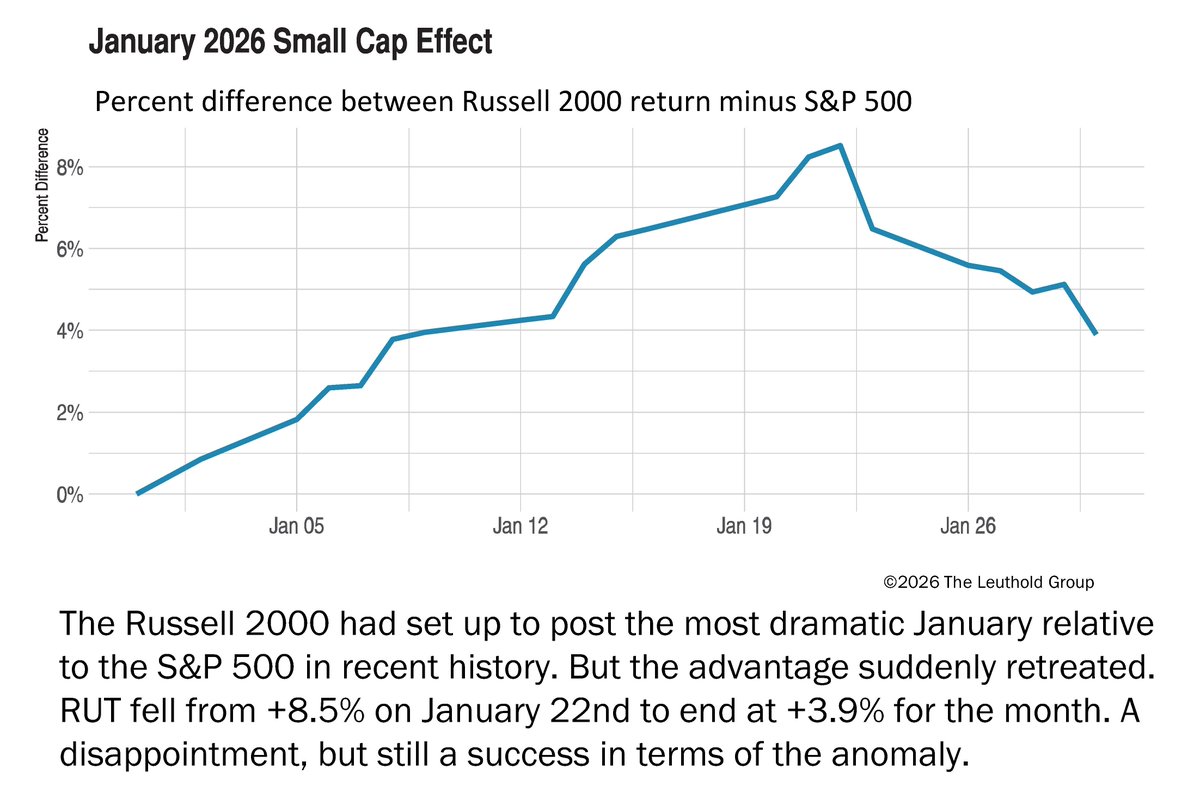
In recent history, only the Russell 2000’s +6% lead over the S&P 500 in Jan. 2021 has been better. Perhaps more notably, this marks only the tenth January win for small caps in the last 25 years.
A January small-cap bounce is a well-known market anomaly, but it's been a no-show for most of the last decade. This year, it was in flourishing—until late January, when smalls gave back a large chunk. Still $RUT's +4% advantage over $SPY was its best January since 2023.