🚀 Introducing TokenWatcher!
Monitor AI API costs, tokens, latency & usage in real time with an open-source observability platform. Built with TypeScript, React & PostgreSQL.
🎥 Demo: https://t.co/O73hnVL50u
⭐ GitHub: https://t.co/oSDCwH207b
I added x402 payments to TokenWatcher.
The goal: let agents pay for TokenWatcher capabilities programmatically instead of requiring a human to sit in the middle.
We now have:
→ paid agent capabilities
→ payment verification
→ payment persistence
→ replay protection
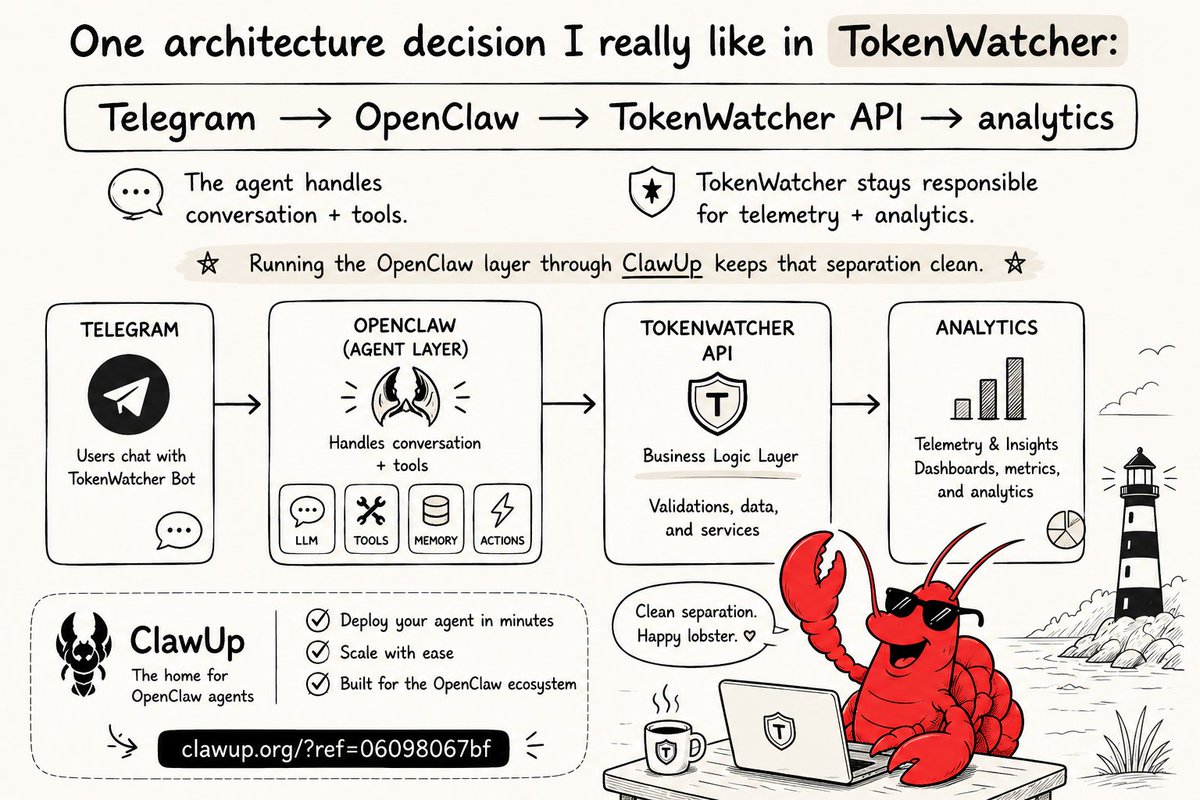
One architecture decision I really like in TokenWatcher:
Telegram → OpenClaw → TokenWatcher API → analytics
The agent handles conversation + tools.
Running the OpenClaw layer through ClawUp keeps that separation clean.
Building an agent?
https://t.co/kjrlQHESHE
Building TokenWatcher made me realize I didn't want my AI agent runtime tangled with my core backend.
I run the OpenClaw layer separately and connect it to TokenWatcher's APIs.
ClawUp made that agent workflow much easier to work with.
Try it here: https://t.co/kjrlQHESHE
Just published a new deep dive on TokenWatcher ⚡
The article covers the architecture, intent routing, tools, security, and the actual Telegram flow.
Read it here 👇
https://t.co/3snMjUtM5y
Raw telemetry is useful.
But turning it into answers is where observability gets interesting.
TokenWatcher turns telemetry into:
→ daily cost & requests
→ provider + model spend + latency + errors
→ endpoint costs
→ token usage
All across Overview, Models & Endpoints views.
I wanted TokenWatcher to feel live without constantly polling the backend.
So I built an SSE pipeline, the frontend handles reconnects + stale heartbeats, then refreshes its query state when new telemetry arrives.
No polling loop. Just live telemetry flowing into the dashboard.
The interesting part of TokenWatcher is the telemetry path underneath it.
The SDK:
→ buffers + batches events
→ retries with backoff
→ flushes on shutdown
No “infinite scale” claims.
Just a telemetry pipeline built to avoid turning every event into a network round trip.
The TokenWatcher SDK to keep the developer experience simple while handling the complexity underneath.
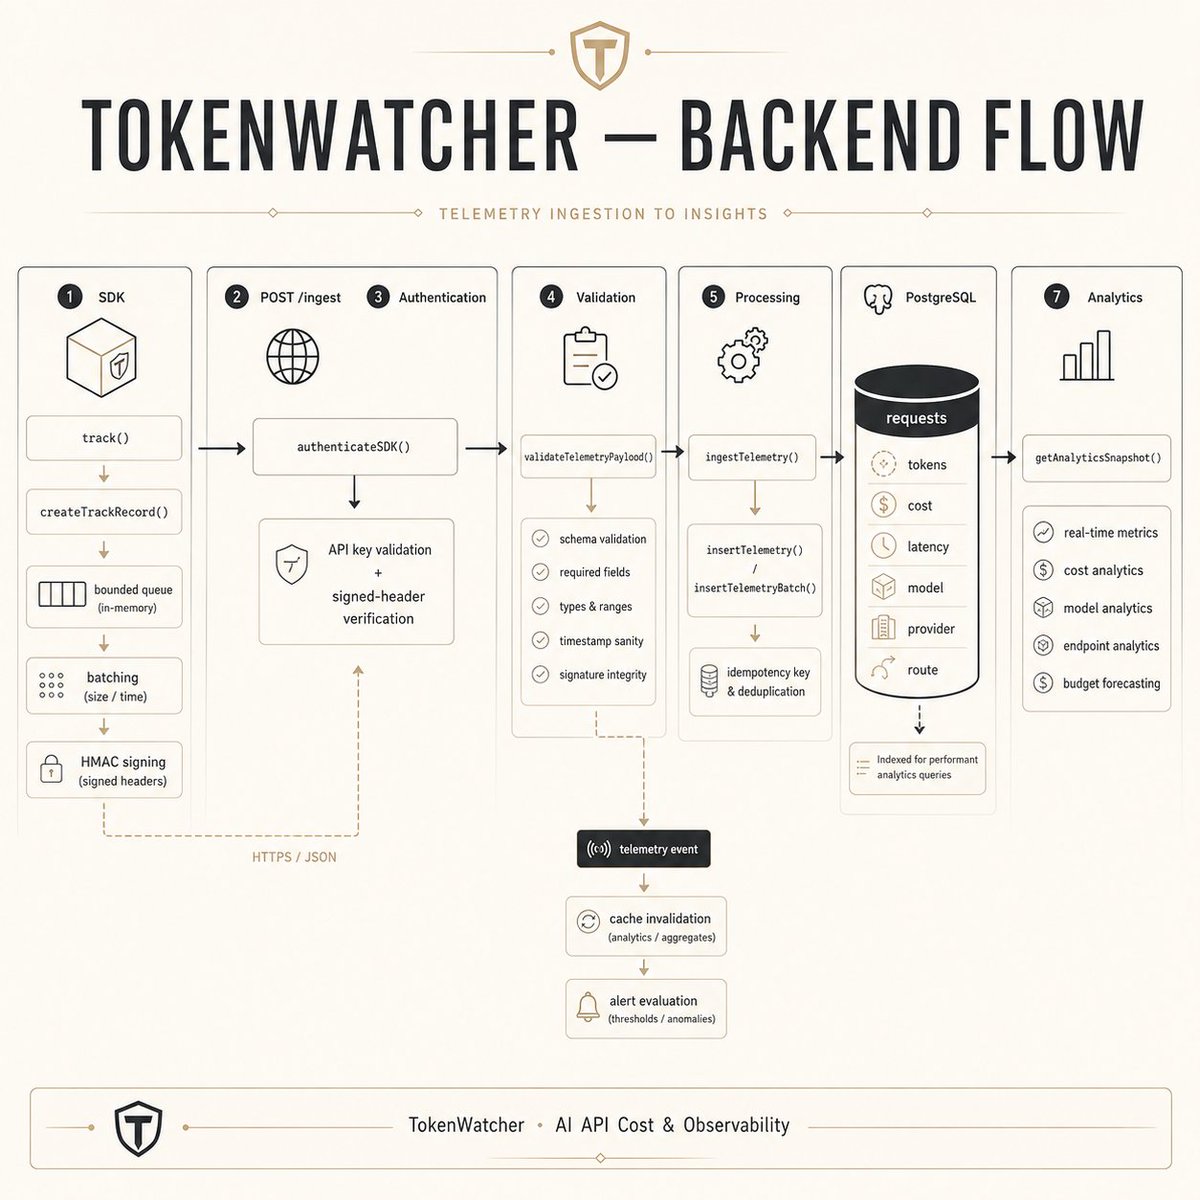
track() → bounded queue → batching → retries/backoff → HMAC signing → /ingest
It handles timeouts, aborts and graceful shutdown so telemetry isn't an afterthought. ⚙️
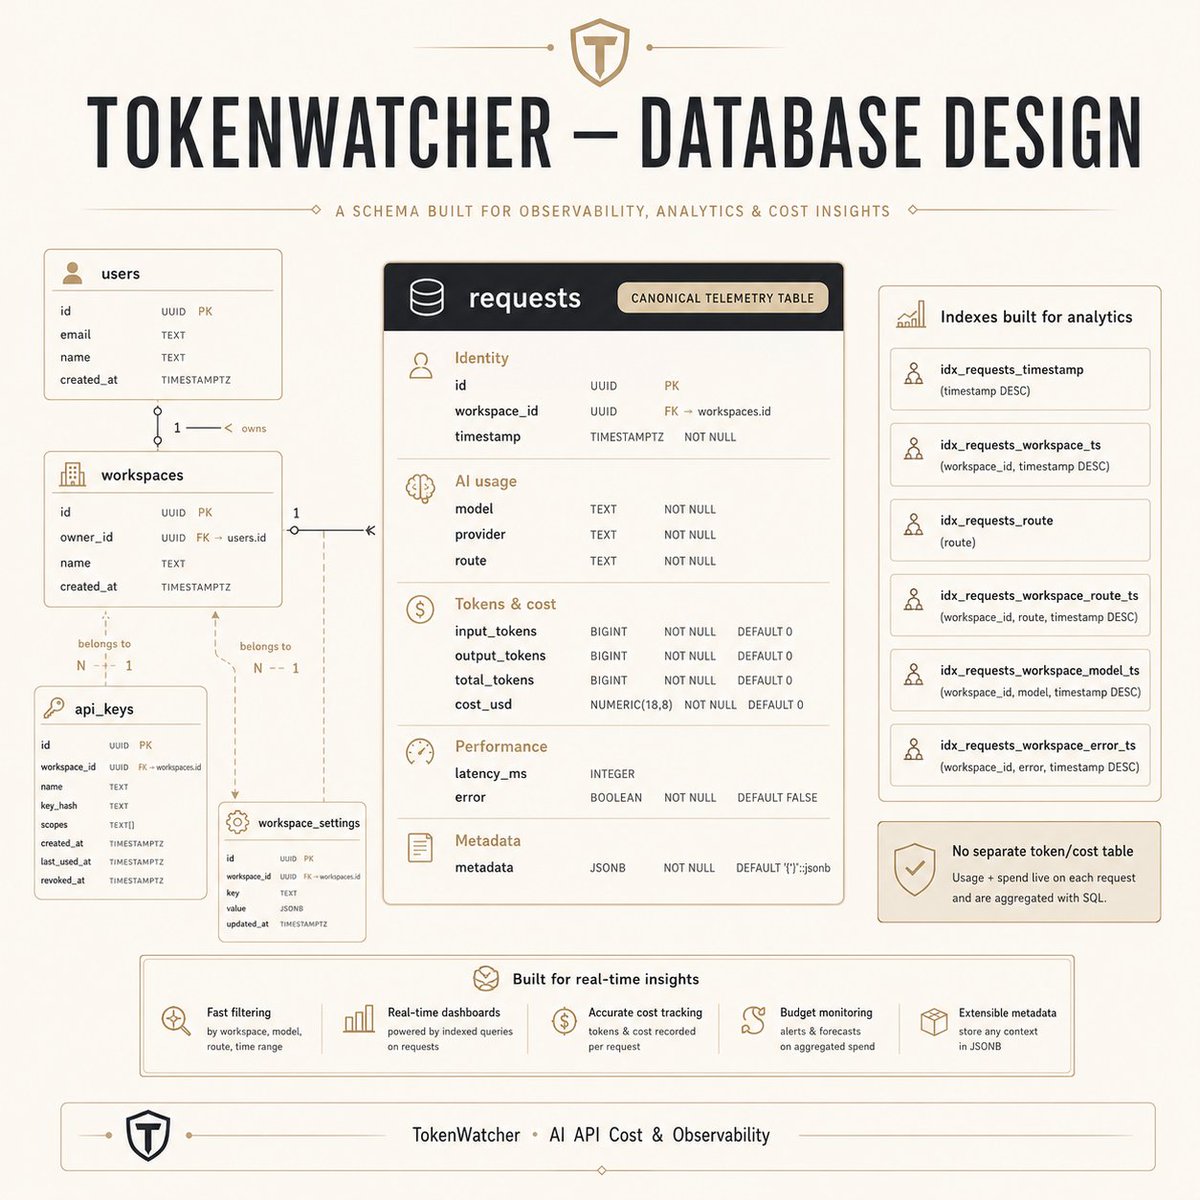
Designing the database behind TokenWatcher.
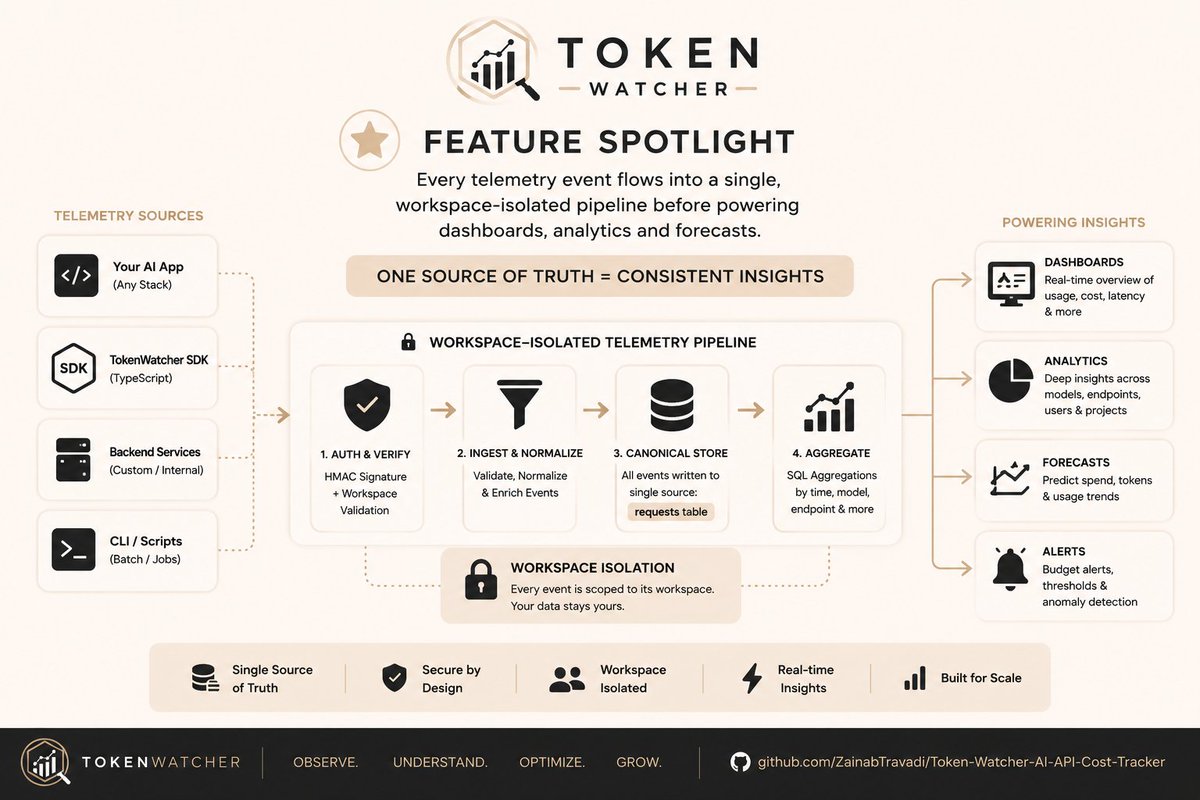
The requests table acts as the canonical telemetry store, capturing tokens, cost, latency, model, provider, route and metadata.
With workspace-aware relationships and analytics-focused indexes, the same data powers real-time analytics.
What happens when an AI telemetry event reaches TokenWatcher?
The SDK batches and signs the event → /ingest authenticates it → the payload is validated and normalized → telemetry is stored in PostgreSQL → analytics and alerts are updated.⚙️
Clean architecture isn't about having more services.
It's about giving every service a clear responsibility.
That's the approach behind TokenWatcher. 🚀
GitHub: https://t.co/oSDCwH207b
ClawUp : https://t.co/kjrlQHESHE
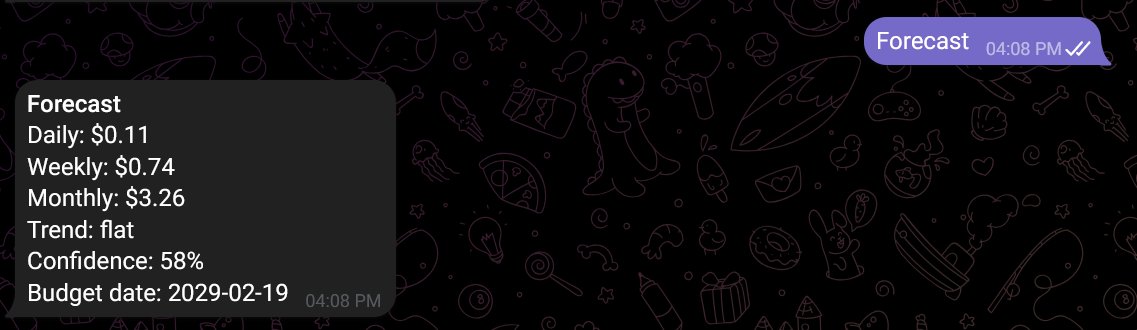
Check your AI API usage without opening the dashboard.
TokenWatcher lets you access telemetry directly from Telegram.
📊 Summary
⚡ Recommendations
📈 Forecast
Try it now: https://t.co/qcaYnftbeN
💰 Cost tracking starts at the source.
TokenWatcher records token usage and cost_usd as telemetry is ingested, then builds dashboards and analytics from the same data.
One source of truth. Accurate spend insights. 📊
#AI#TypeScript#OpenSource
A quick look at how TokenWatcher transforms raw telemetry into meaningful insights. Built for observability, scalability, and production-ready AI applications. 📈
Check it out: https://t.co/qcaYnftbeN
💡 Express Tip
TokenWatcher captures the raw request body before parsing JSON, allowing SDK-signed HMAC requests to be verified server-side.
Better security. Replay protection. Workspace-bound telemetry. 🔒
#ExpressJS#TypeScript#OpenSource