You asked, 🗣️ we listened.
Introducing the ability to export and import your MongoDB Charts dashboards ❗
Easily recreate your favorite charts/dashboards when moving from development to production environments or switching data sources.
↓
https://t.co/fVA0oovHfV
🎉MongoDB Charts now has conditional formatting!
We're excited to announce the release of this feature, which has been the #1 request in user feedback.
See how conditional formatting will make finding insights faster and easier ➡️ https://t.co/3vKxQJoF4u
@fabrefact@razvanilin Thanks for the feedback @fabrefact. Charts is still pretty new so we're still working through our backlog, but a lot more is coming. Feel free to vote/suggest on what's most important at https://t.co/lYkaCd5C3s.
@BenSullins A while ago you asked about my Powerwall Companion app. FYI it's now also available on Android: https://t.co/ADXK5uMV8u. Source for both Windows and Android apps also now shared: https://t.co/NIvMXPc4ja
@gilgNYC@ctrlaltdylan It's always great to hear from #MongoDBCharts fans! If you ever have any feature suggestions, hit us up at https://t.co/YQR18H4QmT or the community forums at https://t.co/RITjsoa060.
Want to make your charts more interactive? Now you can filter a chart based on a click on another chart by using the new click events functionality [beta] in the embedding SDK. https://t.co/GOnRUTeG3Q
#MongoDBCharts makes it ridiculously easy to embed data visualisations into your web apps, but sometimes developers want more than a static chart. Our latest update allows you to add interactivity to embedded charts by responding to click events. See https://t.co/evzOrT54O6
This month we've pushed out some great improvements to #MongoDBCharts, with a bunch of new customisation features to help get that perfect visualisation. https://t.co/VKBwLZedDF
@kore_sar Thanks for sharing @kore_sar! Simplifying your architecture is always a great thing when you can pull it off, and we're so happy MongoDB Cloud is working out for you! If you think of anything else you need from Charts, make sure you submit it to https://t.co/lYkaCd5C3s.
#MongoDBCharts now lets you build a chart from multiple collections, using the power of Lookup fields. Find out how at https://t.co/31sS4LOU5b. #MongoDB#DataViz
Did you know you could build animated charts with #MonogDBCharts? I didn't either, but @MongoDB engineer Kristina Stefanova shows us how to use the embedding SDK to bring your charts to life! https://t.co/IUsDYm7g3Y
MongoDB 4.4 is now GA with new features including:
- Custom aggregation expressions
- Union
- New aggregation operators & expressions
- Connection monitoring and pooling
- Global read & write concerns
- MongoDB Rust & Swift Drivers
Read more here: https://t.co/8zLZhbvFsc
MongoDB Charts now comes with a sample dashboard and movies dataset, making it easier than ever to get started and learn data some new data visualisation skills. https://t.co/3fejgf9qbc #MongoDBCharts#MongoDB





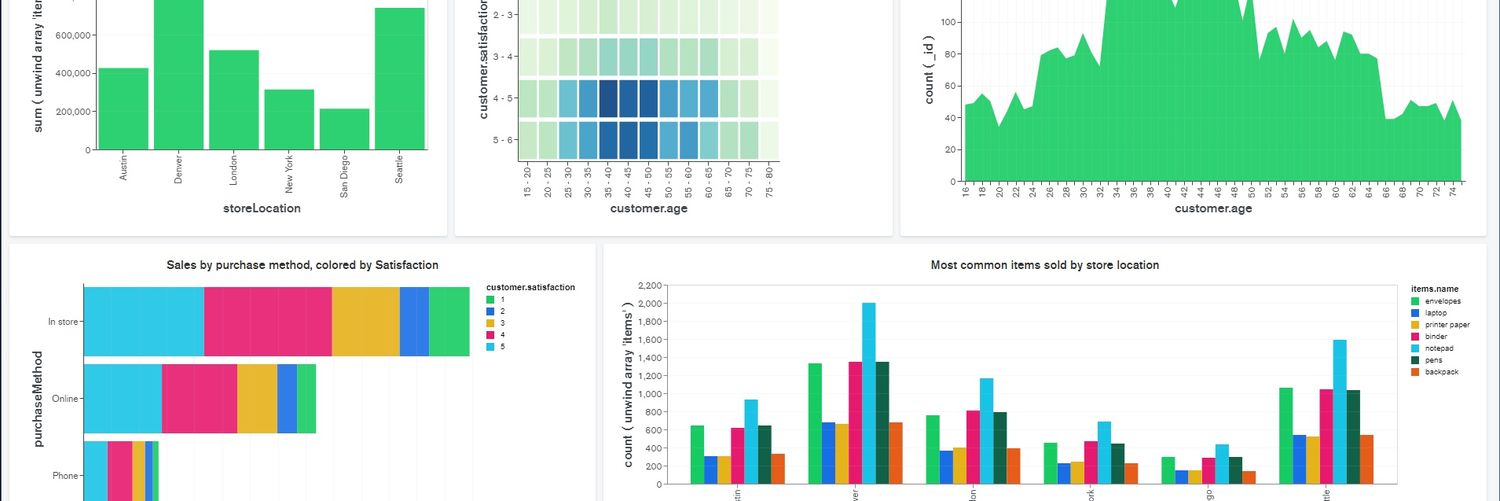


![MongoDB's tweet photo. Want to make your charts more interactive? Now you can filter a chart based on a click on another chart by using the new click events functionality [beta] in the embedding SDK. https://t.co/GOnRUTeG3Q https://t.co/BK7w7PuLoj](https://pbs.twimg.com/media/EsRdZl3XMAMzJts.jpg)


