I would not ignore this.
There are rumblings that the ISM data being released tomorrow is going to come in above 50, with some estimates even over 51.
If that happens, it is very significant.
Here we have:
- Bitcoin
- Copper/Gold
- ISM/PMI
For those who are unaware, the ISM reading is essentially whether the economy is in contraction or expansion based on manufacturing. A reading of under 50 is contraction, and over 50 is expansion.
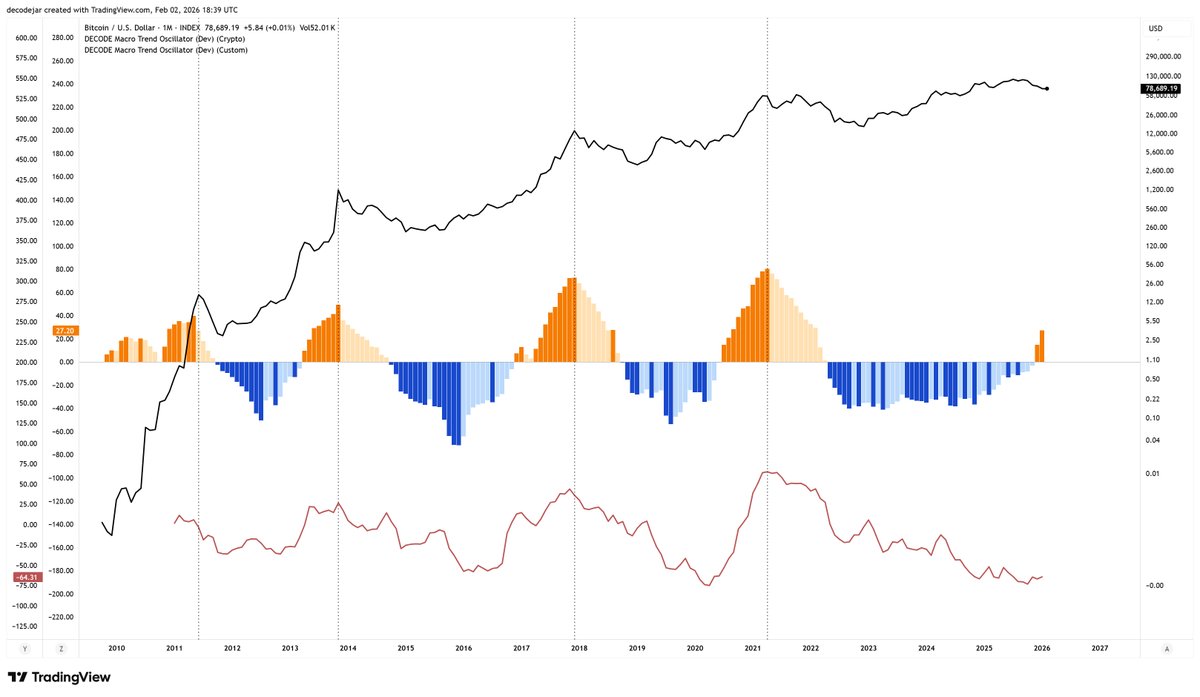
You can see here very clearly, every single time since Bitcoins inception, when ISM has pushed back towards the 52 level after being in contraction(under 50), it has marked that:
1. The Bottom is in for COPPER/GOLD
2. Bitcoin has begun its true expansion phase
You will notice that the PMI reading has been in by far its longest contraction ever, and this is a key piece of data that explains why this bull cycle has been so different.
It is the first time ever that Bitcoin has made new highs whilst the PMI has been in contraction.
It explains why this bull cycle has been so weak because the foundational state of the economy/liquidity has not been there to support it.
Its not a coincidence, by any means.
In addition, this is all happening as GOLD has very likely finished its mega run, meaning COPPER/GOLD is very likely bottomed, with COPPER pushing, in line with high manufacturing and development business happening...
Contributing towards the increasing PMI.
Just as Bitcoin is approaching its invalidation levels for HTF structure break, and almost everyone has now succumb to a year long bear market.
All of this is linked together and telling us the same story.
If PMI comes in close to 52 tomorrow, I expect this to be a market shock and begin the reversal phase throughout Feb.
This is data that truly matters.
One of the longest ISM Manufacturing PMI contraction periods in U.S. history ended this morning with a breakout to 52.6, up 4.7 points from December.
Past breakouts in 2013, 2016, and 2020 served as key catalysts for Bitcoin's major bull runs.
This ends 26 consecutive months of contraction and signals the first expansion since early 2025.
The ISM subindices paint an extremely optimistic picture:
1. New Orders surged 9.7 points to 57.1
2. Production rose 5.2 points to 55.9
3. Backlogs of Orders expanded 5.8 points to 51.6
4. Supplier Deliveries increased 3.6 points to 54.4, reflecting rising demand pressure
5. Prices only edged up 0.5 points to 59.0, showing contained inflation signals
Historically, these PMI reversals mark the shift to risk-on conditions. This is good for 🟠.
I will share this Paid Premium Indicator for FREE FREE FREE
Rules :-
~Follow @Adityaroypspk
~Like ❤️
~Repost 🔄
~Comment = Indicator
This indicator will shared only for those who Follow the above rules
#Bitcoin
𝒥𝐸𝒰 𝒞𝒪𝒩𝒞𝒪𝒰𝑅𝒮 🎪 Gagne tes places pour l’événement de ton choix à Paris La Défense Arena !
Pour participer :
➡️ Abonne-toi à @ParisLaDefArena
➡️ Like, RT ce post et identifie tes amis en commentaire
Tirage au sort le mercredi 30 avril !🍀
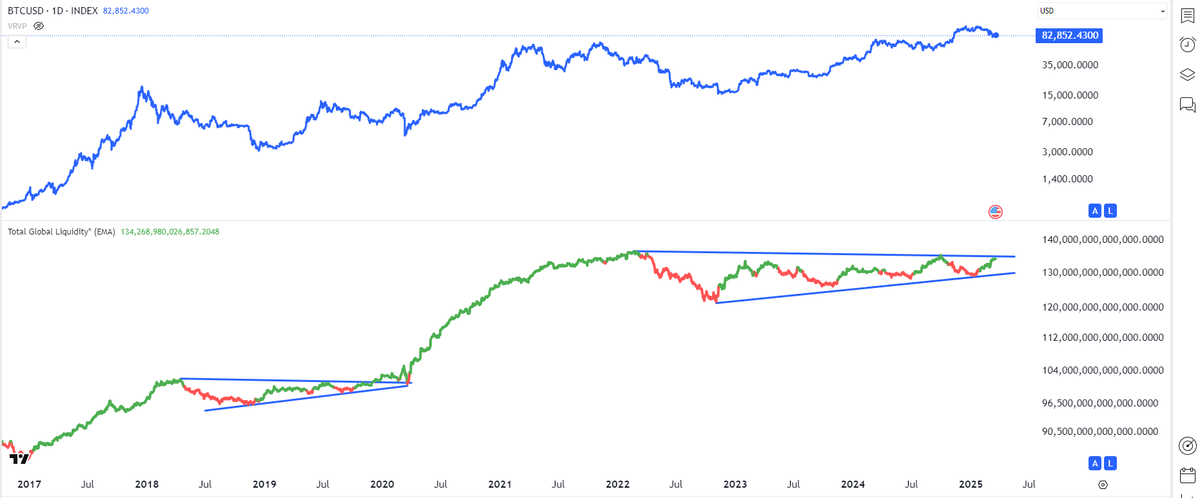
This marks the longest contraction of the Global Liquidity Index in Bitcoins history—three years and counting (measured from the peak). Previous tightening episodes (2014–2016 and 2018–2019) lasted < 2yrs. How much longer will this go on? Surgical cuts from DOGE aside, the structural deficit remains unchanged.
So how can the U.S. government—or any heavily indebted Western nation (debt to GDP > 100%) i.e. most of them—and especially China (the most indebted), refinance if nominal GDP is falling behind interest expenses?
The fiat, fractional-reserve, debt-based system will implode without liquidity injections.
The spice must flow.
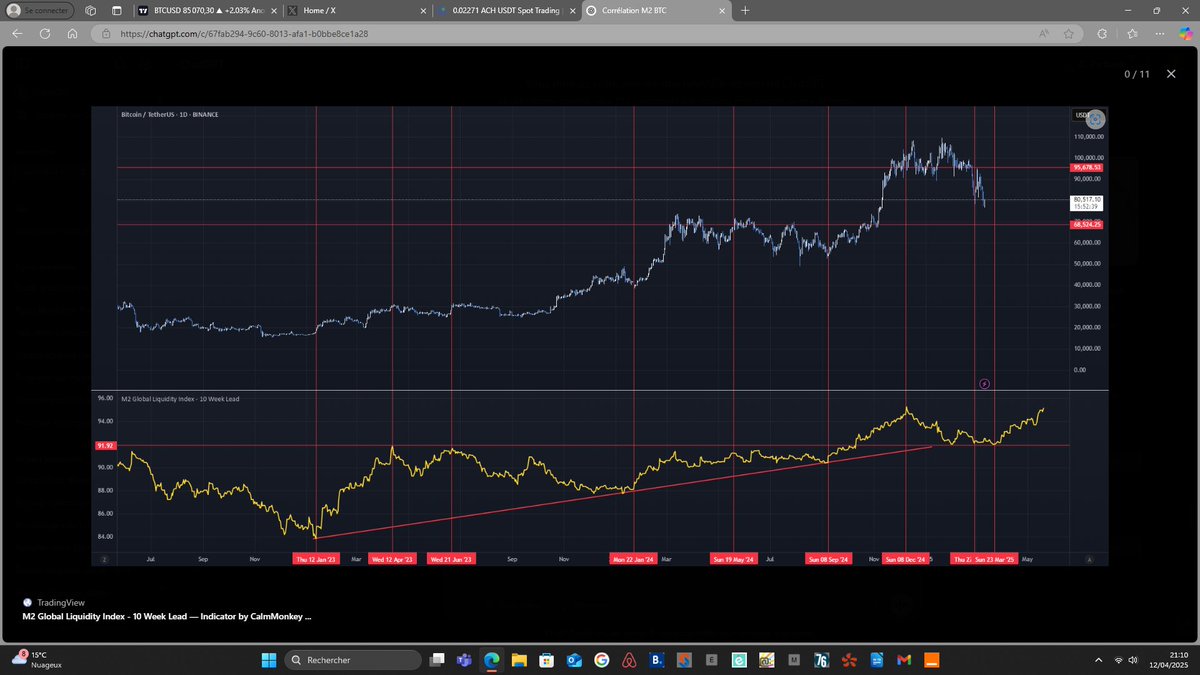
#Bitcoin is flashing a mega buy signal as 3 key macro-economic indicators have aligned to offer a buy opportunity that we last saw around the bottom of the Cycle in November 2022.
The DXY has peaked and declines aggressively, Global Liquidity bottomed and is rising while Chinese bonds also bottomed and are rising aggressively.
In the past 10 years, this combination of parameters have taken place 6 times, twice during each Cycle, one on its bottom and the second when the most aggressive end-year rally started.
Are you still fearful of the recent fundamentals??
Full description on our Telegram channel:
👉https://t.co/g2TlpcusbC
LIKE 👍, FOLLOW ✅, SHARE 🙌 and COMMENT ✍ if you enjoy this analysis!
#BTC #BTCUSDT #BTCUSD #cryptocurrency #Crypto #trading #signals #tradingtips #TradingStrategies #cryptosignals #tradingsignals #cryptotrading #bitcoinsignals
#Bitcoin CME Futures GAP 🕳️
The gap from last November between $77,930 and $80,600 has finally been filled ✅.
One more gap remains above, between $84,200 and $85,900. 📈