@cryptoquant_com@AxelAdlerJr The chart is less about direction and more about intensity.
The index has moved away from high-risk conditions, but it is still far from the washout levels seen near prior major lows.
$BTC is grinding back to $65K on rising open interest and positive funding. Daily funding at 0.0084%, OI pushing 272K.
The problem: no spot demand behind it. Spot and futures demand both still negative.
Look and smell of a short squeeze, not a real bid. Price moved by leverage and bilateral liquidations, not buyers stepping in.
Room to run higher on the squeeze. But a move with nothing underneath is a move on borrowed time.
Broke this down in yesterday's report 👇
تشير بيانات مؤشر حجم التداول التراكمي (CVD) لعملة إيثيريوم على منصة باينانس إلى تحسن ملحوظ في الطلب عليها، حيث ارتفع المؤشر إلى أعلى مستوى له في ثلاثة أشهر. وهذا يدل على هيمنة عمليات ال��راء المتزايدة في التداولات الأخيرة. ويتزامن هذا الارتفاع مع تعافي سعر إيثيريوم، مما يعزز الرأي القائل بأن هذا الارتفاع مدفوع بضغط شراء حقيقي وليس بمضاربات قصيرة الأجل.
وتُظهر البيانات أن مؤشر حجم التداول التراكمي (CVD) لعملة إيثيريوم قد وصل إلى حوالي 64,700، وهو أعلى مستوى له في ثلاثة أشهر، بينما استقر سعر إيثيريوم قرب 1,900 دولار. بالإضافة إلى ذلك، يبلغ معامل الارتباط بين السعر ومؤشر حجم التداول التراكمي (CVD) خلال 30 يومًا حوالي 0.87، وهي قراءة قوية تشير إلى توافق تحركات الأسعار بشكل وثيق مع تدفق أوامر الشراء، مما يُضفي مصداقية أكبر على الاتجاه الصعودي الحالي.
وتاريخيًا، يُنظر إلى ارتفاع مؤشر حجم التداول التراكمي (CVD) بالتزامن مع ارتفاع السعر على أنه دليل على تراكم حقيقي من قِبل المشاركين في السوق. في مثل هذه الحالات، لا يقتصر دعم الارتفاع على انخفاض السيول�� أو تراجع ضغوط البيع فحسب، بل يشمل زيادة واضحة في الطلب الحقيقي. ورغم هذه المؤشرات الإيجابية، فإن استدامة الاتجاه الصعودي ستعتمد على حفاظ مؤشر CVD على مستويات مرتفعة خلال الأيام القادمة. فإذا واصل المؤشر تسجيل مستويات قياسية جديدة بالتزامن مع مزيد من ارتفاع الأسعار، فقد يعزز ذلك استمرار الاتجاه الصعودي. أما إذا استمر سعر الإيثيريوم في الارتفاع بينما بدأ مؤشر CVD بالانخفاض، فقد يظهر تباين هبوطي، مما يشير إلى ضعف زخم الشراء ويزيد من احتمالية حدوث تصحيح سعري قصير الأجل.
Read the complete report to see complete technical breakdown on the evolution of machine-native economic layers and many more interesting happening: https://t.co/IzCdxNfwjN
$2 Billion #AI Agent Crypto Market Cap to hit $200 Billion by 2030
The current $2 billion market is the 1st phase of early-stage frameworks. The market is driven by decentralized compute platforms that lay the infrastructure groundwork before mainstream enterprise integration.
To scale past recent valuations, networks must overcome structural systemic risks.
The ecosystem faces computing scaling dependencies and algorithmic resonance vulnerabilities where matching models trigger simultaneous #liquidity drains.
5/5
Is History Repeating?
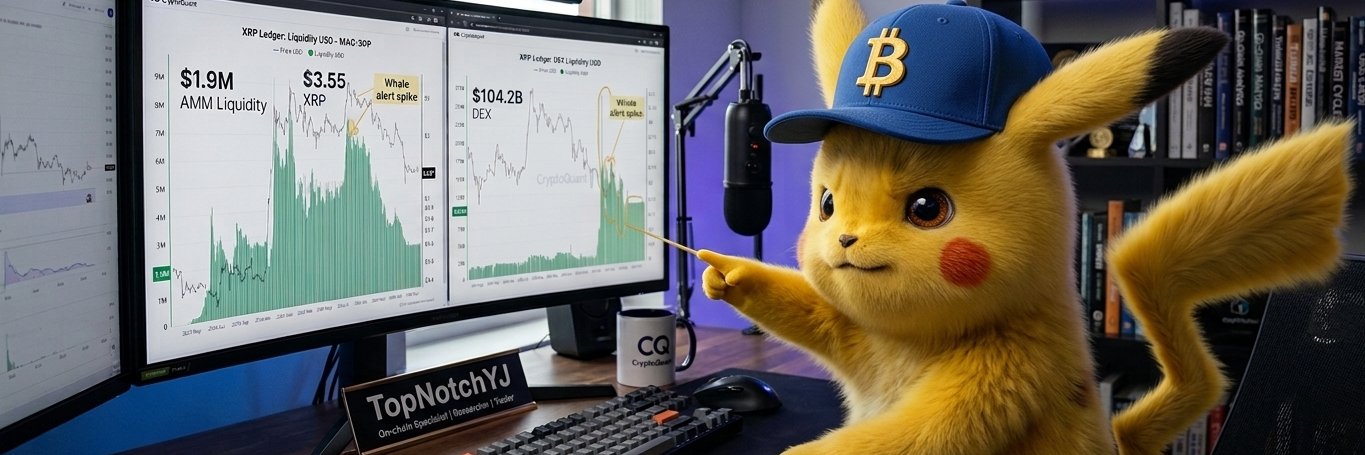
The Transaction Count Data Shows Early Signs Of An Rally Coming.
When Transactions spiked, That's what early sign is beacuse soon after consolidation intensifies and XRP jumps.
Looks, XRP is Aiming $8!
#ripple@Ripple
https://t.co/d1Ok9qf46e
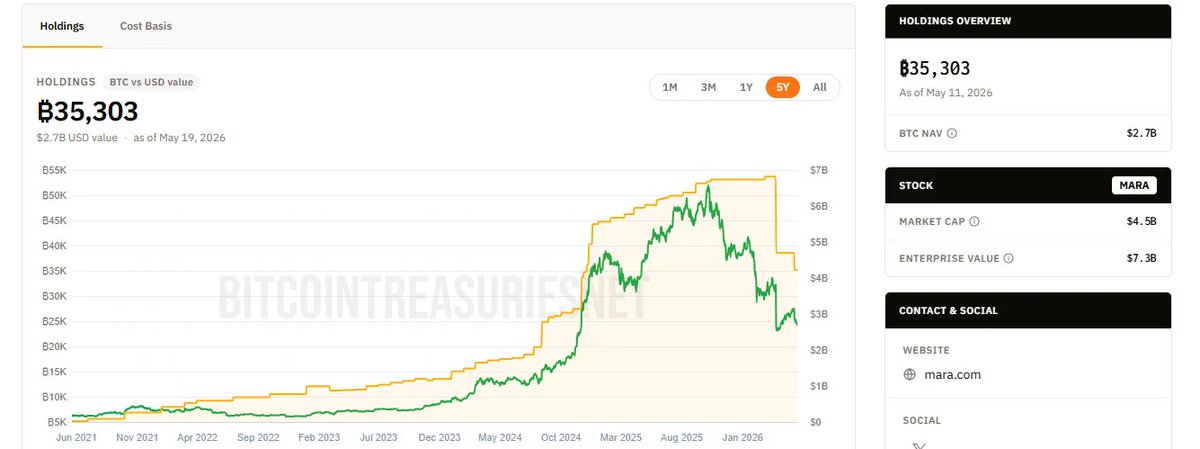
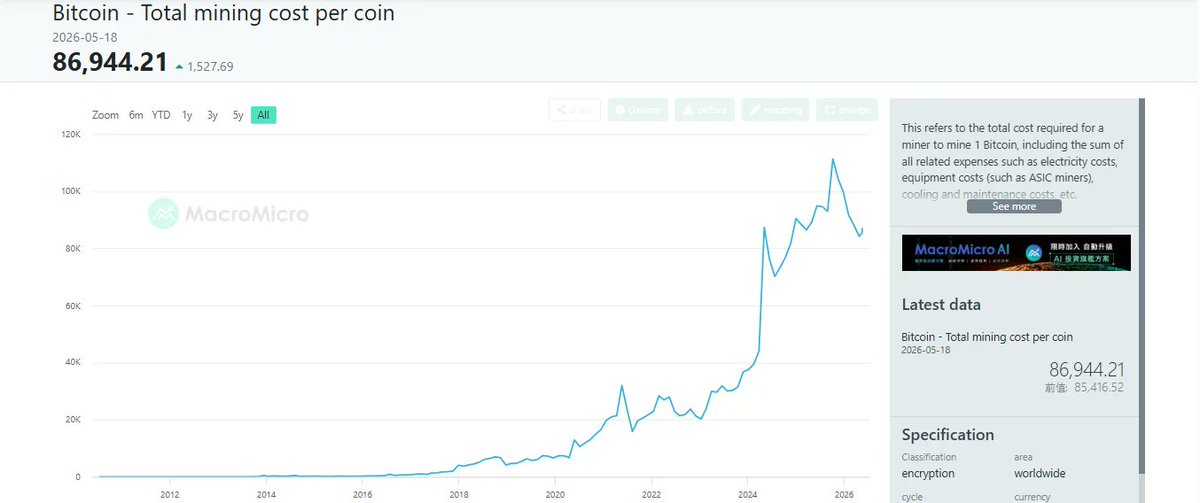
#Bitcoin miners face a brutal structural squeeze. Global #hashrate stays high at 958.01 EH/s, driving production costs to $86,944/BTC while #hashprice has crashed 90% to $0.035. Also giants like #MARA dumped huge reserves from 53K to 35K BTC just to fund desperate pivots into AI.