This reminds me of what Mr. Yang Chen-Ning said about the purpose of learning: he believed that the most important purpose and hallmark of learning is not merely the accumulation of knowledge, but the transformation of intuition and the upgrading of one’s way of thinking. True learning lies in continuously correcting and overwriting one’s originally mistaken or partial intuitions through new ideas, making them more accurate.
When language models first started using tools well, I was sympathetic to the narrative that instead of scaling up language models, all we needed was a strong enough "cognitive core", say 1B parameters, and anything else could be done with tool use, like browsing the internet or executing code. I think a lot of people were sympathetic to this argument, and indeed it is pretty hard to come up with a meaningful task that cannot be in principle achieved by a 1B model with adequate access to tools. For example, any esoteric fact that a large language model would know can be, in principle, retrieved from the internet and reasoned over by a 1B language model.
However I now think this is totally wrong for one simple reason: doing tasks quickly and naturally without tool use matters a lot.
The way that I internalized this reason was actually in my personal journey learning badminton this year. In badminton I am very much like a "1B cognitive core". While I can physically do every movement in a badminton shot that my coach teaches me, it requires a lot of work to mentally remember every cue and put it together. In practice I can do a shot almost perfectly, but I struggle to do it across a point and I definitely can't do it consistently in a game. This is obviously different from someone who has practiced a shot ten-thousand times and effortlessly executes it as a natural instinct.
In the same way, language models knowing a fact internally, without tool calls, is meaningful. The first reason is that we obviously care about speed; you'd much rather get an answer immediately than have the model think a long time to be sure of its answer or browse the web. A second reason is that there are some things that are simply best learned via backpropagation over lots of data. If you ask about how people generally think of the Shambhala music festival, you'd rather a large language model give you an aggregate opinion based on all the data on the internet, than get a regurgitation of the first three reviews that show up in a web search. A third reason is that having to do a lot of work to find an answer is not as reliable as already knowing the answer. While this does not have to be true in theory, it is probably true in practice, at least for now. If you have to re-look up facts or redo a mathematical derivation all the time there is a higher chance of mistakes, which can compound in a long-horizon task.
Once you buy that it is valuable to do things parametrically without tool use, then you must buy the argument that a 1B cognitive core is not sufficient. There is an information limit to how much knowledge can be internalized by a 1B model, and we will surely want AI to know more than that. Even 1T probably won't be enough. We will want the AI to know as much about our world as possible, we will want it to be updated with new information, and our expectations of what AI can do for us will continue to grow.
In summary, tool use enables small models to do a lot more, but those who demand the highest quality intelligence will always want larger models. Bitter lesson strikes again.
Jackson Hole Annual Symposium
*Federal Reserve Chair Walsh will deliver his first Jackson Hole keynote address of his tenure at 10:00 a.m. Eastern Time on Friday, August 28 (titled “Keynote Remarks,” traditionally labeled “Opening Remarks”), with no live Q&A. *
-ECB Executive Board member Schnabel will participate in a roundtable at 11:55 a.m. on Friday;
-Chilean central bank governor Rosanna Costa will join the Saturday wrap-up roundtable;
-Reserve Bank of New Zealand Governor Anna Breman will attend but will not speak publicly, ahead of New Zealand’s September 2 monetary policy statement.
-Historically, the chair’s speech has been the day’s most market-moving event, but it has had no consistent directional impact on the U.S. dollar. Foreign-exchange volatility during the Powell era was greater than during the Yellen/Bernanke era, and a debut appearance does not necessarily amplify volatility.
It's been fun to read these US Gov fact sheets (few a week) recently.
Earlier this week was "Golden Age of Space Transportation", with $SPCX hard carrying the launch sector like Faker.
And $RKLB + other rocket companies as beneficiaries of the 1K launch/reentry goal by 2030.
This month we also had:
- Drone component tariffs
- American Mining / Critical Mineral deals
- Polysilicon supply chains tariffs
and a lot more... So helpful to see what sectors US policy is focusing on.
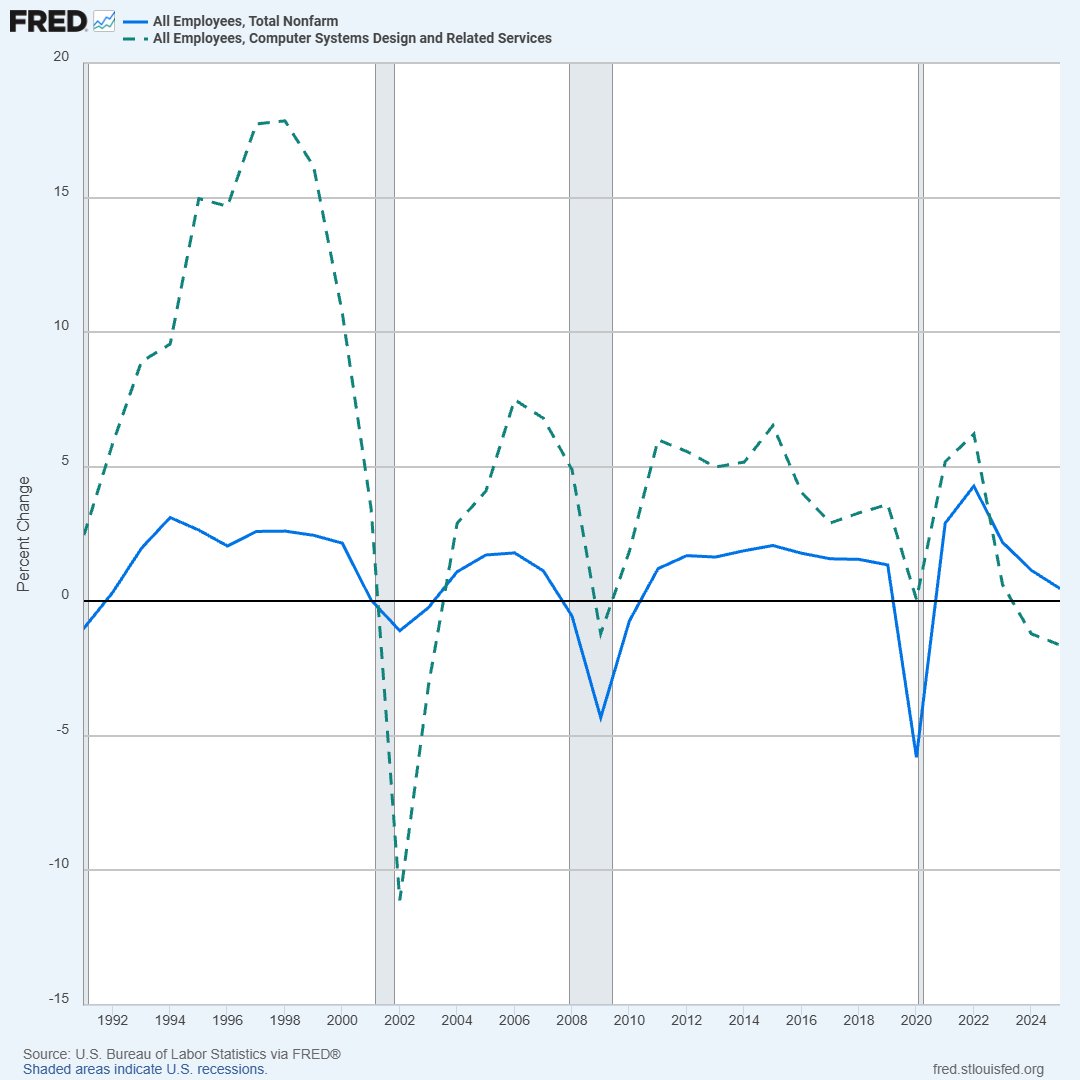
The job-specific shock for software coders was not caused by a slowing tech industry but likely by the emergence of AI tools, says recent research. Visit the FRED Blog to learn more https://t.co/Ng27d724eD
GS Rising Stars and Falling Stars Strategy
The “rising stars” with the largest increases in fund holdings in the second quarter include $Flex, $TXN , $AEIS , $INTC , and $VIAV . Historically, such stocks have often outperformed their peers in popularity in subsequent quarters.
“Falling tide” stocks include $NFLX , $META , $CHWY , and $NRG, which typically underperform thereafter
Citadel Securities said 10 days ago that:
Systematic buyers are getting ready to load up on stocks again after a massive unwind ... The potential for a rebound is building, with the next meaningful mechanical flow may be re-leveraging rather than deleveraging
$GOLD
MS: Gold rebounds rapidly, could surpass $5,000/oz in 2027
1. Gold prices have already reached Morgan Stanley’s fourth-quarter target ahead of schedule, with further upside above $5,000/oz. Gold has reached Morgan Stanley’s previously forecast target of $4,450/oz faster than expected. Despite volatility risks, analysts believe that, based on an improving macro backdrop, central-bank gold purchases, and fiscal concerns, gold has a path to exceed $5,000/oz in 2027, potentially even sooner.
2. Improving macro conditions are driving a recovery in ETF demand, while central banks are adding to reserves on price dips. As the implied probability of further Fed rate hikes declines and the U.S. dollar weakens, ETF gold purchases increased by 70 tonnes in July and August, reversing the 93-tonne outflow seen in May and June. Meanwhile, central banks including those of China and Poland have taken advantage of price pullbacks to increase their gold reserves. China has added 60 tonnes so far this year, while Poland has added 82 tonnes, bringing its holdings to 632 tonnes and closer to its 700-tonne target.
3. Gold has decoupled from long-term real yields, reflecting concerns over fiat-currency depreciation and government debt. Gold prices have recently decoupled from 10-year real yields, continuing to rise even as long-term yields remain flat or increase. This suggests that the market is pricing not only yield levels, but also the underlying fiscal concerns, risks of fiat-currency depreciation, and massive government deficits. A steepening yield curve and the Treasury’s long-term bond buyback program have also supported gold prices.
Regarding HDD
-1. What is the current supply-demand situation in the HDD market? How large is the specific supply gap, and what are the expected changes in supply and demand over the next year?
At present, the three major hard drive manufacturers have disclosed their capacity plans for 2027 through 2029 to major CSP customers. Based on calculations combining these supply volumes with customers’ actual demand, the average annual supply shortfall is expected to range between 30% and 40%. Specifically, in 2026, the current shortfall is approximately 40%. Looking ahead, although the gap is expected to narrow slightly, it will remain at around 30% at a minimum. The fundamental reason for this supply-demand gap is the data storage demand generated by AI computing power. According to estimates, each compute card generates approximately 200 TB of data requiring storage each year. In 2026, the total enterprise HDD capacity that the three major hard drive manufacturers can supply is approximately 1,700 to 1,800 EB. However, based on the total number of existing and newly added compute cards this year, the total volume of data requiring storage will reach approximately 3,000 EB. Therefore, there is a significant gap between existing production capacity and actual demand.
-2. What is the specific basis for the estimate that each compute card generates 200 TB of data per year?
Considering the future launch of GPUs such as those based on the Blackwell architecture, will this volume of data generation increase further? This data was initially estimated based on NVIDIA H100 GPUs. During discussions with ByteDance personnel in the first half of 2025, they reached roughly the same conclusion based on internal calculations. As technology continues to evolve, including the launch of Blackwell-architecture GPUs, the amount of data generated by a single compute card may indeed be greater in the future than it is today.
-3. How should we view the current 30% to 40% supply-demand gap, as well as HDD manufacturers’ willingness to expand capacity and future expectations?
Seagate and Western Digital are mainly increasing EB capacity through two approaches: upgrading existing technologies and converting consumer-product production lines into enterprise-product production lines. Toshiba, meanwhile, plans to add four to five new production lines, two to three of which are expected to be completed by the end of 2027. However, a significant increase in overall capacity is not expected until late 2027 to 2028. Each new Toshiba production line has annual capacity of approximately 1KK (1 million) HDDs. Based on the current maximum capacity of 24TB, a single production line can add approximately 24EB of capacity per year.
-4. What is the current status of Toshiba’s agreements with CSPs?
The agreements currently signed with CSPs have been extended through 2028–2029. It should be noted that the prices under these long-term agreements do not include the cost of onboard memory in hard drives (such as DDR4). Memory prices are highly volatile, and such costs will be charged separately on top of the locked-in base price.
-5. Given the current significant supply-demand gap of 30% to 40%, why do manufacturers appear reluctant to expand capacity while also signing long-term agreements with customers that specify pricing through 2029?
Manufacturers are cautious about capacity expansion mainly for two reasons. First, supply bottlenecks in upstream raw materials are the primary constraint. Existing raw-material supply is still insufficient to fully meet the needs of next-generation product technology upgrades, and current production lines can already consume all available raw materials, reducing the urgency of expansion. Second, hard-drive production lines require heavy capital investment. Taking Toshiba as an example, it is increasing investment in production lines because it originally had relatively few enterprise-grade production lines (only around a dozen globally), leaving limited room to increase capacity through technological upgrades. As a result, it has had to invest in new production lines. This investment plan was previously slowed by the pandemic and the decline in demand in 2023, and has only recently resumed as demand has recovered.
-6. What is the pricing logic behind the long-term pricing agreements for 2027 to 2029? Is it mainly based on Toshiba’s own circumstances?
The pricing is primarily determined by the company’s own raw material supply conditions and the amount of deliverable production capacity. Since Toshiba’s overall capacity is relatively limited, its cost of sourcing raw materials may be slightly higher than that of its competitors, resulting in relatively higher calculated costs and pricing. By comparison, while the other two major manufacturers may offer lower quotes, the proportion of their total capacity that they are willing to commit under long-term supply agreements is also smaller.
-7. Given the current widening supply-demand gap, does the industry tend to raise product prices, or schedule demand exceeding capacity for subsequent quarters? What factors primarily determine pricing strategies?
The industry’s capacity allocation and pricing strategies are implemented in tiers. Approximately 70% to 80% of actual capacity is locked in through long-term agreements with large CSP customers, forming a stable base business. The remaining 20% to 30% of capacity is sold at a premium to infrastructure internet customers or other customers with strong demand, and this portion is the main source of additional profit. Therefore, it is not simply a matter of choosing between raising prices and delaying deliveries; rather, the balance is achieved through this dual-track approach. The portion committed to CSP customers under long-term agreements ensures the company’s basic profit level and its performance commitments to shareholders, while premium sales of the remaining capacity represent a key source of future profit growth and enhanced valuation.
-8. How large is the gap between current market prices for the non-long-term-agreement portion and long-term agreement prices?
The price gap between the two is very significant. Emergency procurement quotes for 24TB hard drives in the market have already reached US$1,000, translating to nearly US$50 per TB, far above long-term contract prices.
-9. Given current market dynamics, what will the future price trend be for the non-long-term-agreement portion (i.e., the spot market, which accounts for 20%–30% of capacity)?
Prices for this portion are expected to continue rising. Based on the information currently available, planned quotes for the next quarter have already exceeded US$1,200. The market is now able to accept prices above US$1,000. Looking ahead, supply is expected to be extremely tight in the fourth quarter of 2026 and the first quarter of 2027, especially for 24TB products, with virtually no excess inventory available for traditional B2B internet customers. As these customers must continue investing to avoid falling behind in AI development, they will have no choice but to accept the current high market prices.
-10. Will the long-term agreement price trends for Seagate and Western Digital in 2027, 2028, and 2029 be similar to those of Toshiba?
Broadly consistent; no significant differences are expected.
-11. Based on the AI server configurations of leading CSP customers, what trends are emerging in the SSD-to-HDD mix and total capacity configuration?
In AI servers and data centers, the allocation mix of storage media is undergoing significant changes. Due to the rapid recent increase in SSD prices, SSDs’ share of total storage capacity (at the exabyte level) is declining. As the foundational storage medium for data, HDDs will account for an increasingly large share of baseline data center investment. From a storage capacity perspective, HDDs are expected to return to around 90% of future data center capacity, resulting in an approximately 9:1 ratio versus SSDs (currently, HDDs account for roughly 80%–85%). In terms of total procurement spending, hard drives currently account for around 20%, while memory and SSDs still make up the major share. The main reason for this shift is the rapid increase in SSD costs, along with the industry’s growing recognition of HDDs’ value as a long-term storage medium, given their self-recording characteristics. In addition, technological progress is also driving this trend. For example, some data centers in North America have, through technological optimization, already been able to achieve around 80% of QLC SSD performance with HDD clusters. As this performance gap narrows, customers are more inclined to adopt the more cost-effective HDDs.
-12. What is the current state of HAMR technology adoption in the industry, and what are the technology roadmaps and expectations of the major hard drive manufacturers?
HAMR is the technology path that the industry generally plans to adopt. It is expected that by late 2027 to early 2028, all three major hard drive manufacturers will transition to HAMR technology in their next-generation or higher-end products. Before then, there will be a generation of transitional products, namely microwave-assisted magnetic recording hard drives. Western Digital’s progress currently is also broadly in line with this timetable. With HAMR technology, a single hard drive using around ten platters can readily achieve capacities of 40 to 50 TB. Looking ahead to 2028–2029, as other new technologies are introduced and combined with platter-stacking technology, HAMR drives may support up to 16 platters. If single-platter HAMR storage density reaches 5 TB by then, a 16-platter drive could achieve 80 TB of capacity. It is expected that around 2030, next-generation products with single-drive capacities of 80 TB will emerge.
-13. Given that Seagate already has HAMR products in use at customer sites, while Western Digital is also advancing transitional technologies such as ePMR, how should the current product performance and technology strategies of these two manufacturers be evaluated?
PMR and MAMR are essentially the same technology, differing only in name. Western Digital and Toshiba’s strategy is to extend the benefits of the currently relatively mature, stable, and reliable technology path for as long as possible, and then transition to HAMR technology around 2028 once its potential has been fully exploited. The rationale behind this strategy is to reduce risk. HAMR technology requires the use of glass platters, and Toshiba does not want to replace multiple core components, such as platters and heads, at the same time. Therefore, Toshiba’s approach is first to upgrade from 10 platters to 11 or 12 platters based on its existing MAMR technology, while switching to glass platters. Once the assembly process and other aspects related to glass platters have stabilized, it will then transition to HAMR head technology. Seagate, by contrast, has adopted a more aggressive strategy and invested heavily in HAMR technology at an early stage. According to the data, as of the first quarter of 2026, shipments of its HAMR products accounted for only 30% of its total shipments. Based on Seagate’s approximately 44% share of the global market, its HAMR product shipments account for only 15% to 20% of the global total. Currently, Toshiba and Western Digital are benefiting from the stable yields and cost control enabled by MAMR or ePMR technology, without requiring major production-line adjustments. The benefits of Seagate’s early HAMR deployment are expected to become apparent only when the industry broadly transitions around 2028. Although their paths differ, all will ultimately converge on HAMR technology.
-14. How should the evolving competitive landscape among the three major manufacturers in the hard drive sector be viewed?
At present, the three manufacturers have a certain tacit understanding, all seeking to avoid falling too far behind technologically. Toshiba’s market share is just over 10%. Having entered the enterprise market relatively late, it has been more aggressive in investing in hardware production capacity in order to catch up and capture a larger share. Seagate, meanwhile, invests more in technology R&D. Western Digital has adopted a more conservative strategy, especially after its acquisition of SanDisk and subsequent spin-off efforts, tending to maximize the short-term benefits of its current hard drive business. It can only rise to around 15%, and the overall landscape will not fundamentally change.
InnoLight’s Q2 Results Beat Expectations, with NPO Opening Up New Growth Opportunities
InnoLight released its 2026 interim report. In the first half of the year, the company generated RMB 41.778 billion in revenue, up 182.49% year on year, and RMB 13.651 billion in net profit attributable to shareholders, up 241.70% year on year. The growth in attributable net profit significantly outpaced revenue growth, with profitability remaining solid. In Q2 alone, the company recorded RMB 7.917 billion in attributable net profit, up 228.19% year on year and 38.05% quarter on quarter. If the Q2 quarter-on-quarter trend is linearly extrapolated, attributable net profit in Q3 and Q4 could reach approximately RMB 11 billion and RMB 15 billion, respectively, potentially lifting full-year attributable net profit to around RMB 40 billion, above market expectations.
Together with Eoptolink’s recently announced equity incentive plan, the two industry leaders have both released positive signals during the interim-report season, further confirming the solid earnings foundation of China’s leading optical module companies. As the four major North American cloud providers raise their full-year capital expenditure guidance to approximately US$745 billion, the strong outlook for the optical module industry appears highly certain. Meanwhile, driven by the generational upgrade from 800G to 1.6T transmission rates, InnoLight and Eoptolink are expected to see a gradual improvement in profitability, with clearer paths for revenue and earnings growth.
Looking ahead, NPO/2.4T optical modules are expected to become a key engine driving InnoLight’s earnings growth. In addition to being applicable to the traditional scale-out segment, NPO is expected to continue benefiting from the industry trend of “optics replacing copper” as adoption ramps up in the scale-up segment. The scale-up segment also represents incremental market opportunity rather than a substitute for, or displacement of, traditional optical modules. Furthermore, the continued expansion of supernode deployments is expected to further drive adoption of the NPO technology route, providing additional validation of the sustainability of earnings expansion for leading optical module companies such as InnoLight.
Source: Kaiyuan Securities