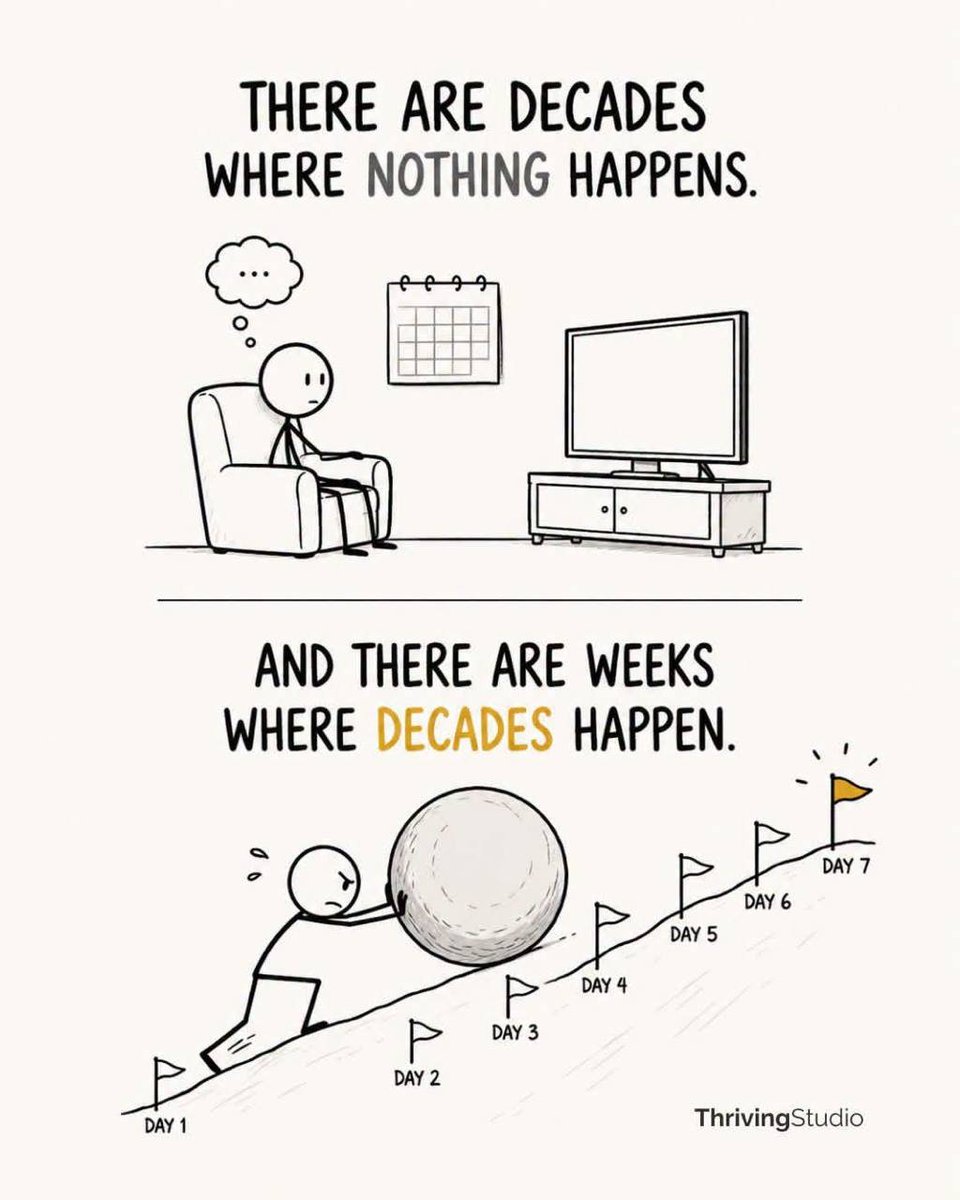
My Letting Go after 20+Years, & the ensuing +1500%
~ My Trading Journey
My personal documentation is finally here, after some procrastination, worrying about imperfection, and spending a couple minutes looking for the publish button on the substack. Due to the sheer volume to process, I have to break it down to 4 parts for easier editing and reading.
The documentation is in the form of rearrangement and further elaboration on my X posts (you know I have been ranting a lot on almost everything, sometimes without restraint).
Trading is a tough business. I am stepping into age 54 this month, and I nearly quit in 2022 after 20+ years of struggle. I know how hard and mentally shattering it is. The funny thing is that only after I nearly quit, my personal pivotal point can really begin, and I learn and progress the most in this few years about trading (or more appropriately investing?) and about almost everything else in life.
Not everyone is that lucky to have a mentor who truly take care of your interests when you first started trading. My kids are still in their teens, and they are my motivation and target readers. I have their interests at heart when I write the documentation, but whether they will listen to me is surely another story!
It is important to know that this documentation will not give you the holy grail or the answers to all your questions. You still have to find them yourself - an important message in the documentation is that ultimately you must find your own path.
Lastly, I have learned so much from all you guys from your sharing and interactions, that I can absorb them into my process, and I thank you all for being a part of my journey!
Happy reading ~😉
Part 1:
My 20+ years of Struggle, My Turning Point, and a Process which Suits Me
https://t.co/wdm2Oifj6p
Part 2:
The Golden Rule of Investing (Stop Loss/Exit Plan, Let Winners Run vs Sell into Strength)
https://t.co/jo4LD1QTDZ
Part 3:
Portfolio Management/Position Sizing, Mindset, Self Work & The Danger of Ego
https://t.co/aAirGOE6Ox
Part 4:
Some collection of posts on Tradings/ Life
https://t.co/nXLkTh2m1u
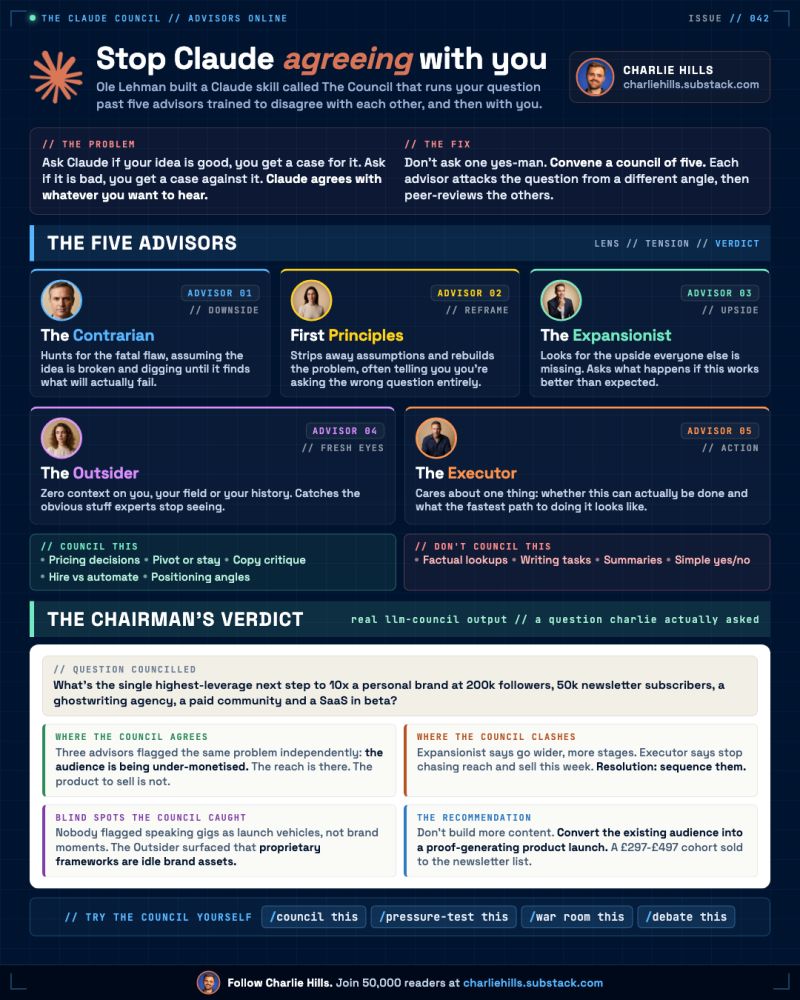
Claude will gaslight you, until you install this skill.
It's called The LLM Council.
You ask a question. 5 advisors attack it from different angles. Then they peer-review each other before giving you the verdict.
How it works:
1. You ask a real decision question.
2. 5 advisors attack it from different angles.
3. They grade each other's work anonymously.
4. Chairman synthesises one verdict and the next step.
Install in 4 steps:
1. Download the skill
https://t.co/mnpPNSnDXu
2. Open Customise skills in Claude
3. Upload the SKILL.md file
4. Type /llm-council
One Claude tells you you're right.
Five Claudes show you where you're wrong.
Get more free AI guides here https://t.co/1F12fOTjss
Repost ♻️ to help someone in your network.
P.S. Credit to Ole Lehmann for building it.
Mistake 1 is not trusting the price action, and too hesitant to react, and being inflexible that the market has to behave, PB, or setup in some way first before taking a long position.
The market doesn’t revolve around your prediction or your bias. Most of the time you just need a definable risk and size responsibly.
Mistake 2 to be revealed, or maybe you should find out yourself from own experience last year.
There again things can be different, this can be a bear market although I have my personal bias that it is not, and certainty the geo political conflict is not yet over.
My Top 5 Free APIs and Libraries for Stock Screening & Trading Dashboards
Many people have been asking about the specific APIs and libraries I use to build my stock screening tools and trading dashboards. After extensive testing, I’ve narrowed it down to a few reliable tools. Here is a breakdown of my current tech stack based on my personal experience.
1. TradingView Screener (Unofficial Library)
For my Pre-market Gappers scan, I rely on a TradingView screener library. While this isn't an official API, it provides scanning results and criteria identical to the TradingView desktop software.
GitHub: https://t.co/CnqYjd0gTr
Pros: Highly accurate; matches TradingView’s powerful UI filters.
Cons: There is a 15-minute data delay. Unless you require sub-second real-time scanning, this is usually negligible for swing trading or early-day prep.
2. Finviz Finance Library
I primarily use this to scrape news and market sentiment. It’s excellent for aggregating headlines and URLs directly from Finviz.
GitHub: https://t.co/pxEHMaxgIb
Use Case: Automatically fetching the latest news for specific tickers to understand the "catalyst" behind a price move.
3. TradingView Lightweight Charts & Tradingview Widgets
This is my go-to for technical analysis visualization.
GitHub: https://t.co/Cm2i4XCcXR
Chart Widgets: https://t.co/veAqqDf2Dp
The Difference:
Lightweight Charts: Best for building custom tools. It’s high-performance and allows you to program any custom indicator you can imagine.
Chart Widget: If you want a "plug-and-play" experience, this is easier but comes with a 15-minute delay and limits you to native indicators (no custom Pine Script/logic integration).
4. Brokerage APIs: Charles Schwab vs. IBKR
I have integrated both, and here is how they compare:
Charles Schwab API: Completely free. The only "catch" is that you need to manually refresh your tokens weekly.
IBKR API: While the API is free, real-time data usually costs $1–$2/month. It also requires you to have TWS (Trader Workstation) or IB Gateway running in the background.
My Verdict: I prefer Schwab for daily use. It’s more "lightweight" as long as you remember to update your tokens over the weekend.
5. Apache ECharts
ECharts is the "all-rounder" of data visualization. I use it to complement TradingView’s charts.
Official Website: https://t.co/d29UYJaIWt
Use Case: While TradingView is more professional for price action, ECharts is superior for Post-Trade Analysis in my trading journal. The interactivity and ability to visualize complex equity curves or win-rate distributions are top-tier.
------
Of course, there are plenty of superior paid resources out there. However, if you’re a trader just getting started with vibe coding, these free tools are perfect for getting your hands dirty and sharpening your skills first.
Feel free to share more in the comments!
I’d build a strategy around longer holds, smaller position sizes, and wider stops—and just accept that I’ll miss a lot of “optimal entries.” But that doesn’t mean you have to miss a lot of trades. If your intended hold is strategically longer, a perfectly precise technical entry matters a lot less, and getting the trend right matters more.
Now that I think about it, that’s basically true with traditional swing trading too. If swing traders just slowed it down, took less size, used slightly wider stops, and focused on catching the trend, they’d probably do better than trying to nail precise entries and exits.
The main differences between a traditional swing system and what I’m describing are:
- Slower, higher-timeframe entries and exits—no 5-minute, 15-minute, or even 30-minute charts; probably hourly and up.
- Higher trailing moving averages—you likely wouldn’t use the 10; most of the time you’d use the 20.
The playbook would revolve around weekly charts and larger bases, where the move has more duration and you don’t need to be so reactive to price changes.
Long story short: i'd focus on catching big trends with smaller size, with the intention of getting paid for holding longer.
In my world, most of the money is made from being right on very few chart lines -- in the past year only four.
Two more lines are coming into play
https://t.co/gDeM5nTRIY
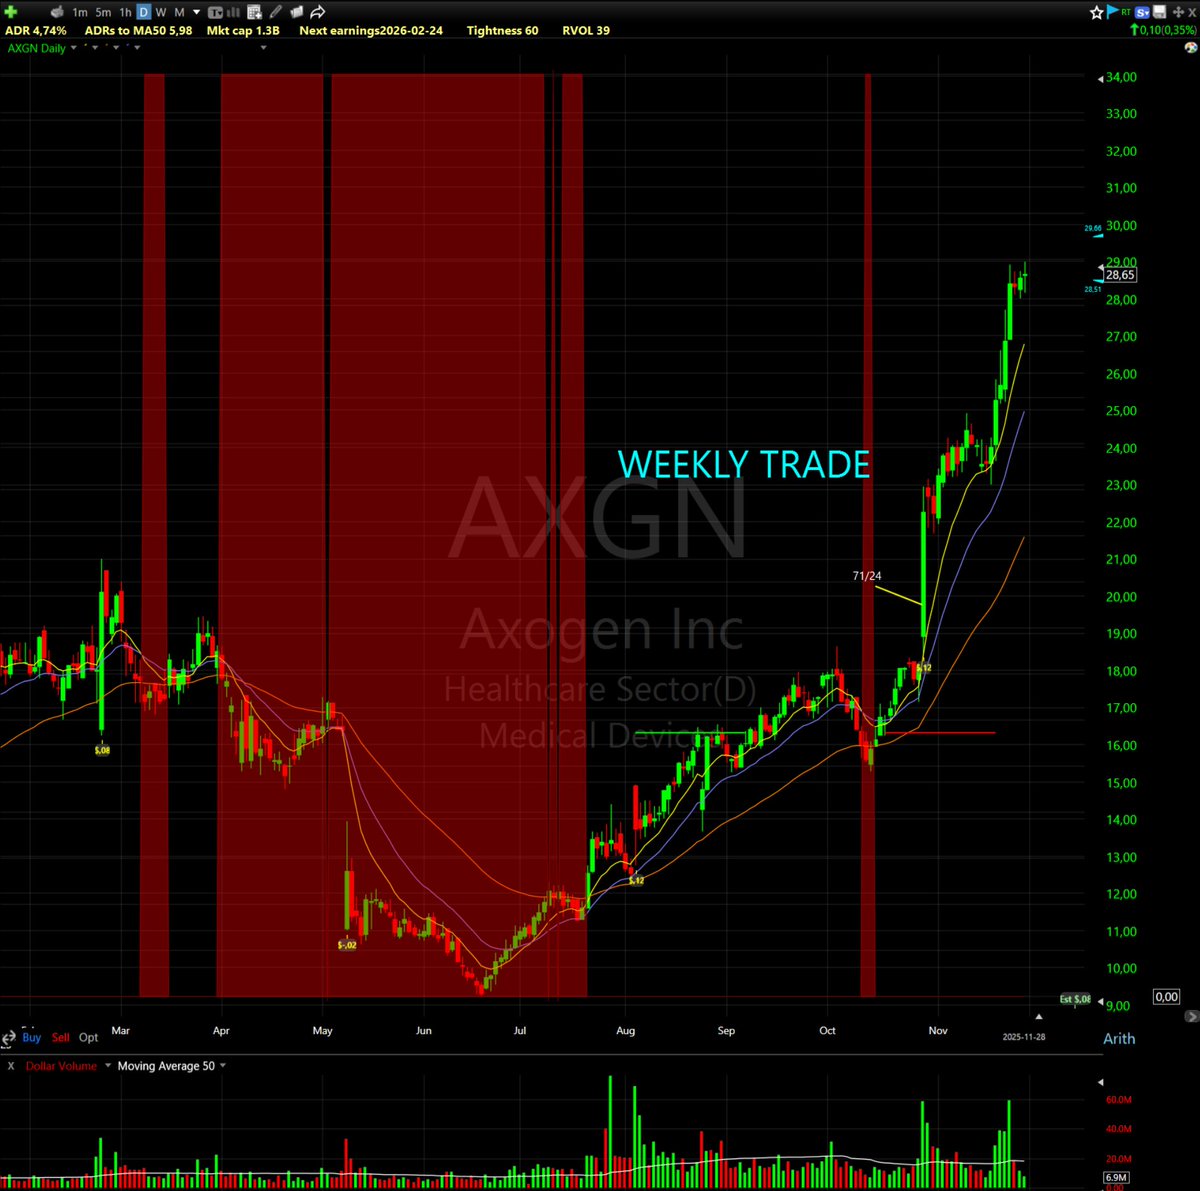
In aug I started live test of a new strat. on weekly charts (with money).
Basically buying bo of inside week on stocks showing momentum & new 8q high in EPS or rev >30%.
Been lucky cathing $BITF in sep and $EXAS in nov.
Looking to really scale up this system in 2026.
Multi-Timeframe Entry Framework (based on a combination of Oliver Kell's Cycle of Price and Qullamaggie's Breakout)
1. Scan for Strong Daily Uptrends (The Setup Phase)
Look for stocks that show:
✔ Price above rising 10- and 20-day EMAs
✔ Trend structure intact (higher highs & higher lows)
✔ Strong relative strength vs. the market
✔ A prior upside expansion (30–100%+ move) showing strong demand
If the daily chart isn’t in a powerful uptrend, there is no trade.
2. Daily Pullback (The Opportunity Phase)
This is the key:
The setup begins when the daily chart pulls back into the rising 10- or 20-day EMAs.
What this means:
The trend is still up
Momentum is digesting
Supply is coming out in a controlled pullback
A fresh buy point is forming
This is where most traders start to get fearful — but where you get ready.
3. Switch to the Hourly Chart (The Trigger Phase)
Once the DAILY pulls back into the rising EMAs:
👉 Now look at the HOURLY chart.
On this shorter timeframe, the pullback will usually look like a small downtrend (lower highs / lower lows).
That’s exactly what we want.
Wait for this hourly downtrend to complete by forming:
✔ A higher low on the hourly
✔ A tightening range
✔ A momentum compression
✔ A reclaim of the hourly 10/20 EMAs
This is the “wedge pop.”
4. The Wedge Pop = The Buy Signal
Buy when the hourly chart pops back above its 10/20 EMAs, breaking out of the wedge.
This confirms that:
The hourly downtrend is ending
The daily pullback is resolving
A new upswing in the larger trend is beginning
It is the perfect marriage of:
✔ Daily trend
✔ Hourly entry precision
✔ Tight risk
5. Stop Placement
Put the stop:
✔ Below the hourly wedge low
—or—
✔ Below the low of the daily pullback zone
This gives:
Small, defined risk
High reward potential (since you’re entering before the daily trend resumes)
6. Managing the Trade
Once the trade is in motion:
✔ Take partial profits into the first expansion
✔ Trail the remaining shares
Using:
The 10-day EMA for fast movers
The 20-day EMA for slower movers
✔ Add on later hourly pullbacks (base-n-breaks) only if the daily trend remains powerful.
The Entire Strategy in 3 Sentences
👉 Wait for a strong stock to pull back into the rising daily 10/20 EMAs.
👉 Switch to the hourly and buy the wedge pop when the hourly chart breaks back above its 10/20 EMAs, with a stop at the wedge low.
👉 Sell some into strength, trail the rest.
Here is a breakdown of my stock swing trading strategy I used to:
• Average triple-digit % returns for the past 6 years,
• With minimal drawdown (<10%)
• Entering EOD (do everything in <30min/day)
Here is the process in 5 steps:
(This is a long one, bookmark for future reference)
---
Step 1:
--> The first thing to trade momentum breakouts is to find stocks that made a new, fresh leg higher and established a new trend.
You will see the 8/20/50 EMAs all stacked and trending, indicating strong momentum in the stock (big money supporting it).
It's very important that it's the first leg and fresh, stocks that already had consolidations and are trading in their 3rd and 4th legs of the intermediate trend have a lower chance of having a successful, multi-day breakout.
---
Step 2:
--> I want my CML indicator (custom momentum & linearity indicator) flashing GREEN.
I developed this to scan and filter stocks with the right amount of momentum and linearity. If not, you will be trading stocks that are choppy at the moment, and data shows the probability of your stops being taken out is high.
---
Step 3:
--> Look for the first valid volatility contraction pattern, riding the 8/20 EMAs layer.
This is the step before the breakout, and you want to see the volatility contract, with the top and bottom trendlines converging together.
This shows that in the case below, sellers are being absorbed, and buyers are about to break through the least amount of resistance, taking prices to major levels quickly.
That's the foundational principle of the volatility contraction/expansion cycle, and we want to find these stocks about to make the expansion leg in the direction of the established momentum (or uptrend).
---
Step 4:
--> Now look for the breakout candle, breaking through resistance, and having a nice close.
This should be stronger than the preceding candles, and I don't want to buy after 2-3 big green candles in a row.
If there are 1-3 tight candles before, the better.
---
Step 5:
--> After the breakout, I ride the swing for 5 days, regardless of what happens.
I place my stop below the LOD, move to break even around the 1:1 RR mark, and close at the end of the 5th day.
We look for an asymmetric move and look for a positive risk-to-reward relationship.
It's all about positive expectancy!
---
I developed this strategy after studying 6000 stocks for 3 decades, through all market conditions.
I go long and short, so also profit in bear markets as well (did +60% in 2022 with <10% max DD).
I enter at the end of the day, in the last 20 minutes of the trading day.
This allowed me to have a life as well during the day. No need to be glued to your charts all day, or not even during the first hour, looking for entries.
If you study and develop your edge, you will make it in this business.
If you want to go deeper on my process, software I use, and how I scan for them using TC2000 and TradingView, make sure to watch the 2.5-hour video series in my pinned post in my profile.
Go and make it happen 📈
Hey, that's a good question! Love these types of discussions.
Here are a couple of things that really help me increase my performance while reducing stress and enjoying life.
- Switching to pullback buys
- No intraday charts, only dailies, and doing other things with my time instead of staring at charts all day.
- Focusing on the market first, contrary to the majority being taught. Trading the market waves, and trades are only the vehicles used to get exposure for it.
- Giving more weight to portfolio management, with total risk in mind.
- That previous point allowed me to have larger stops, be more patient with my trades close to entries, and let those work instead of being shaken out on minor reactions. (Improved performance & mental stress)
- Focusing on one structure only, one setup only for all my trading processes. Really reducing the number of indicators, removing volume, 10 types of setups I was trading, etc.
- Trimming into strength - helped me smooth my EC and be more consistent in my trading.
- Reducing my universe to only the best liquid leaders, only 50 stocks I'm allowing to trade, no random or low liquidity junk stock anymore.
That's more than 1 thing, but I wanted to highlight that it's a process... you iterate your system, your rules at each market cycle and/or each month when you review your performance. Brick by brick you get 1% better everytime.
Trading is freaking hard, that's an expertise that take years to get to performance level, and remain a work in progress until the end.
Hope it helps ;)
Qullamaggie Setups to Study:
$BTC June 11 2016
“This is when you start looking for setups. When it makes a move, big move, and the 10, 20, and 50 start moving higher. This is when you start stalking for a setup. And here it is—look, literally the next day we got a setup. Look at it, look at how tight it is. Puts in a really tight range, gets tighter and tighter, and when the 10-day catches up, that’s when you get the breakout.”
— Qullamaggie
All lines/annotations are as he drew and went over them.
Using pLOD instead of a traditional LOD stop, paired with slightly smaller size to balance the added risk, has been a breakthrough for my account these past few months. The thesis was simple: everything’s been going up. Instead of trying to nail perfect entries with tight LOD stops, I realized it’s better for my account to just get in and ride the trend, giving positions more room to breathe and avoiding getting chopped out. It’s all based on the notion of letting time pay rather than size, coupled with the idea that the trend is your friend. Continual improvement 🙏
The past 1.5 months have probably been one of the best periods in my career.
Truly the one skill I’ve been trying to master more and more and enhance over the last years is crafting a prioritized universe. It’s one of the best, if not the best, superpowers in trading imo, right after nailing down risk management principles and aspects.
My aim is always one: ''To track a universe where the chance of an asymmetric opportunity is greatly increased.''
My thought process for doing this is the following:
1.Basic filter - scanning from platforms: reduces the list of 6,000 stocks to about 1,000.
2.Separating true momentum elements from simple uptrends: narrows it down from 1,000 to 150.
3.Adding narrative, story, fundamentals, expression of momentum, theme alignment, and behavioral elements as bonus factors: further refines the list to 30–40 names, with added prioritization.
You always see my mention the word ''Phenomena''.
The market can never be contained in a box. There are so many different variations of technical expressions, that’s why, long ago, I shifted from looking for A+ setups to looking for A+ phenomena. A phenomenon is a blend of technical, behavioral, and fundamental elements and truly that's what makes a difference.
The structural, fundamental, and behavioral elements that create asymmetric opportunities remain the same over time, while the ways of capturing these through setups can differ from period to period.
$ONDS, $RR, $OKLO, $IONQ, $RGTI, $IREN, $CIFR, $ABAT etc have been some that have contributed the most so far.
Most traders watch the market index. Pros watch the leaders. 🔄
Sector rotation creates opportunity if you know where to look. Here’s how I track it 👇
1. Leading Stocks: Focus on which names are moving higher while the market chops. True leaders separate themselves early.
2. Consolidations: After a big move, strong stocks tighten up instead of breaking down. That’s where new opportunities form.
3. Relative Strength: Compare stocks vs. the indices. If they outperform during market weakness, funds are rotating in.
4. Themes: Leadership clusters around stories — AI, biotech, batteries, rare earths. Stocks don’t move alone.
5. Rotation Signals: When one sector fades, another steps up. Your job is to spot which leaders attract capital next.
6. Confirmation: If several stocks in the same group show setups at once, you’ve found where the money flows.
📌 I’ve taught this to thousands of traders. Rotation isn’t random. Learn to follow the leaders, and you’ll always know where to move your capital.