Walking is the most underrated medicine in the world.
It lowers blood sugar, blood pressure & reduces your risk of early death.
Here's how to get the full effect with 8 simple steps:
1. Don't chase 10,000 steps.
SILVER: On the left...the chart I issued in December last year. On the right...What happened next. Don't tell me technical analysis is 'astrology for men' or voodoo.
$Gold will probably close above its 50 day MA for the 1st time since mid March. A close above the 50 day MA will confirm that it made an intermediate term low on June 30. The next upside target is the 100 day MA.
$SILVER Here we are.. We initially had a fake breakdown of the triangle (lower time-frames), which is not unusual. These continuation patterns often produce fakeouts before the real move. While triangles are technically neutral, when they form within a downtrend, they statistically tend to resolve in the direction they came from; in this case, lower. That's a probability, not a certainty.
As I've mentioned before, $61.50 remains the key level. Until silver convincingly reclaims that area, I remain cautious. Gold, meanwhile, is showing a cleaner breakout structure, so I currently prefer the gold chart over silver.
Could silver still break higher? Absolutely. That's why we wait for confirmation rather than predicting. But for now, I'm sticking with the levels and scenarios I've outlined over the past week. Let price do the talking.
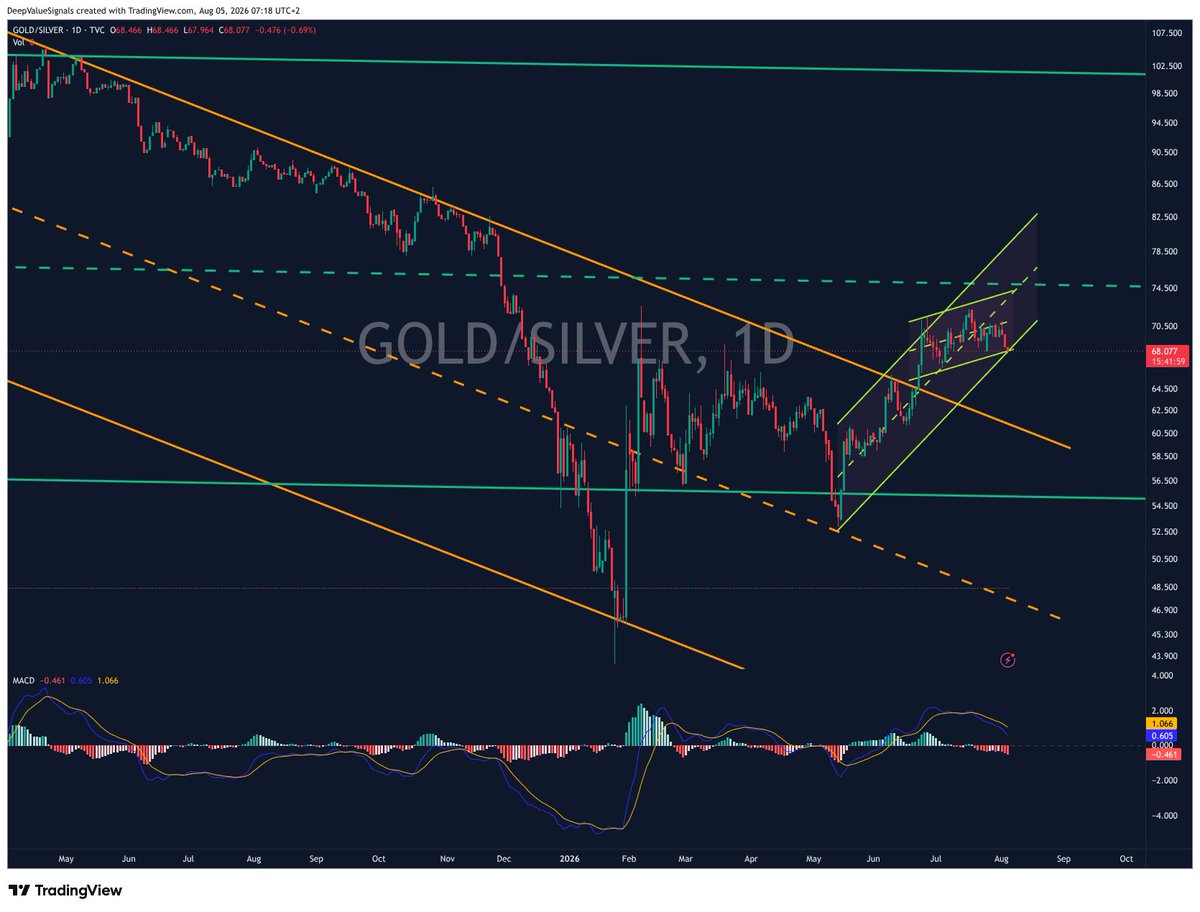
Lastly, here’s the $GOLD / $SILVER Ratio. A few weeks ago, I outlined the possibility of a breakdown because the major breakout still hasn’t been properly backtested. That backtest zone sits roughly in the high-50s.
In the short run, that could mean a powerful catch-up move in silver as money rushes back into precious metals. But don’t lose sight of the larger structure: this may simply become a higher-low backtest before the GSR resumes upward, which would once again favor gold over silver.
So enjoy the silver strength if it comes but don’t get blindly euphoric. This ratio remains one of the most important charts to monitor.
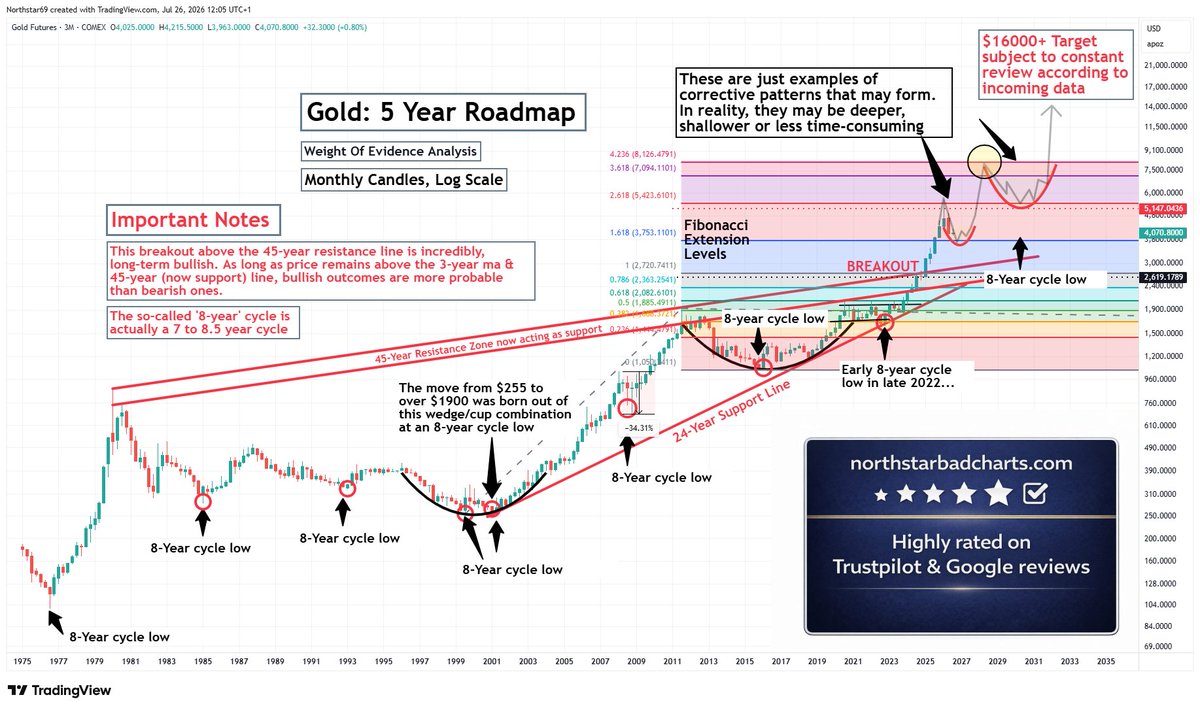
$GOLD is officially in breakout mode on the daily. Now we need to see whether the weekly - and potentially the monthly - can confirm it.
The ratio charts I posted last week remain intact. If they continue to play out, we could be seeing a 1974-style rotation, where oil leads and gold, silver, and the broader commodity complex catch up afterward. It's not a prediction that history repeats exactly, but the sequencing is looking increasingly familiar. The weekly and monthly closes will be key here...
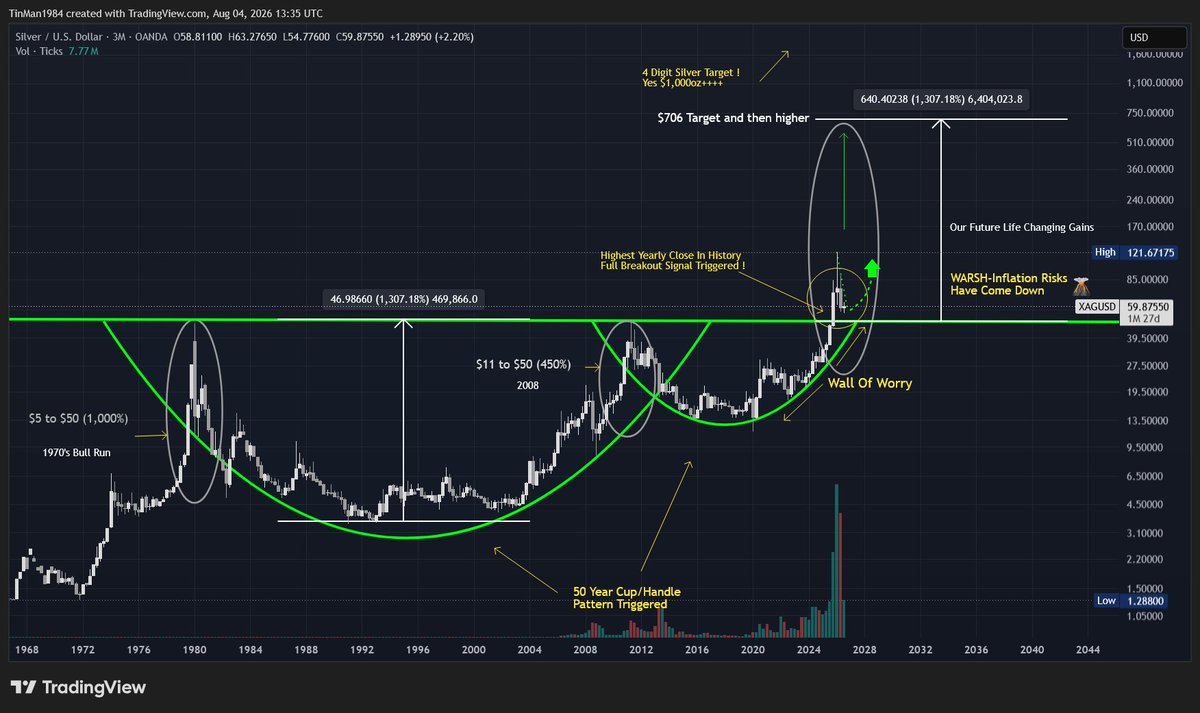
#Silver Traders think they are winning by flipping in/out of physical metal. The risk will become reality in the near future.When people most want physical Ag it won't be available to retail at any price. Never sell your fire insurance and never sell your Ag in a bull this big
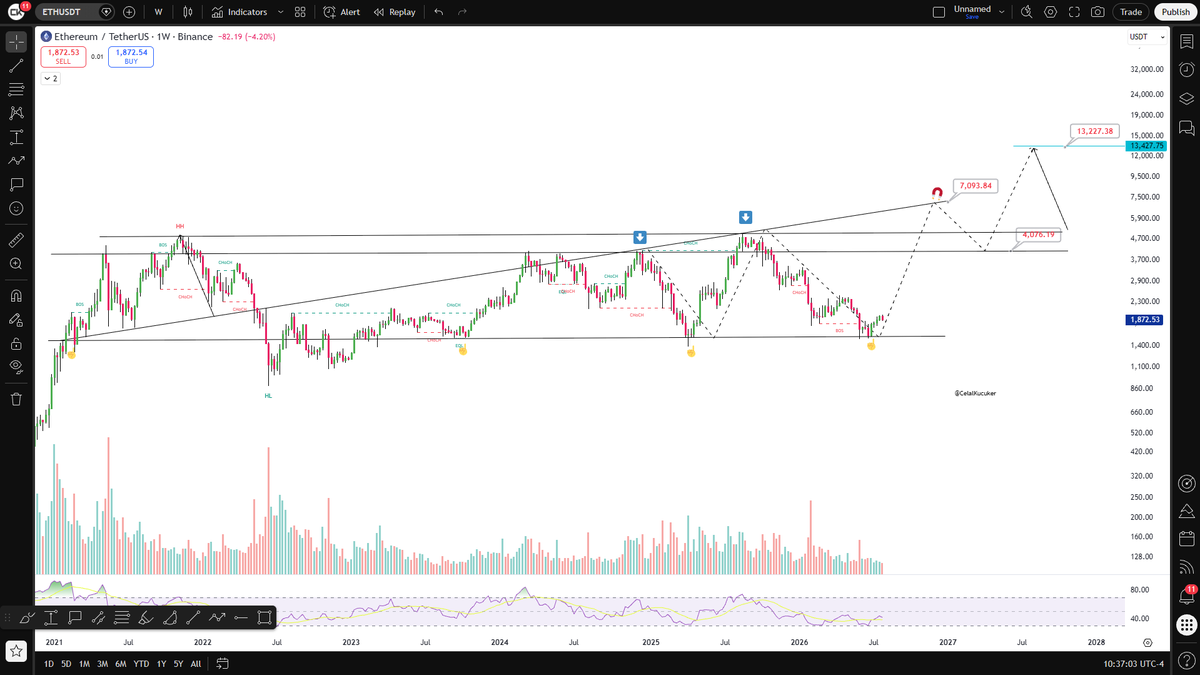
Ethereum has one of the strongest charts I've ever seen.
$ETH roadmap $4,000 → $7,000 → $13,000 in 2026–2027.
The Clarity Act could accelerate this move faster than most people expect.
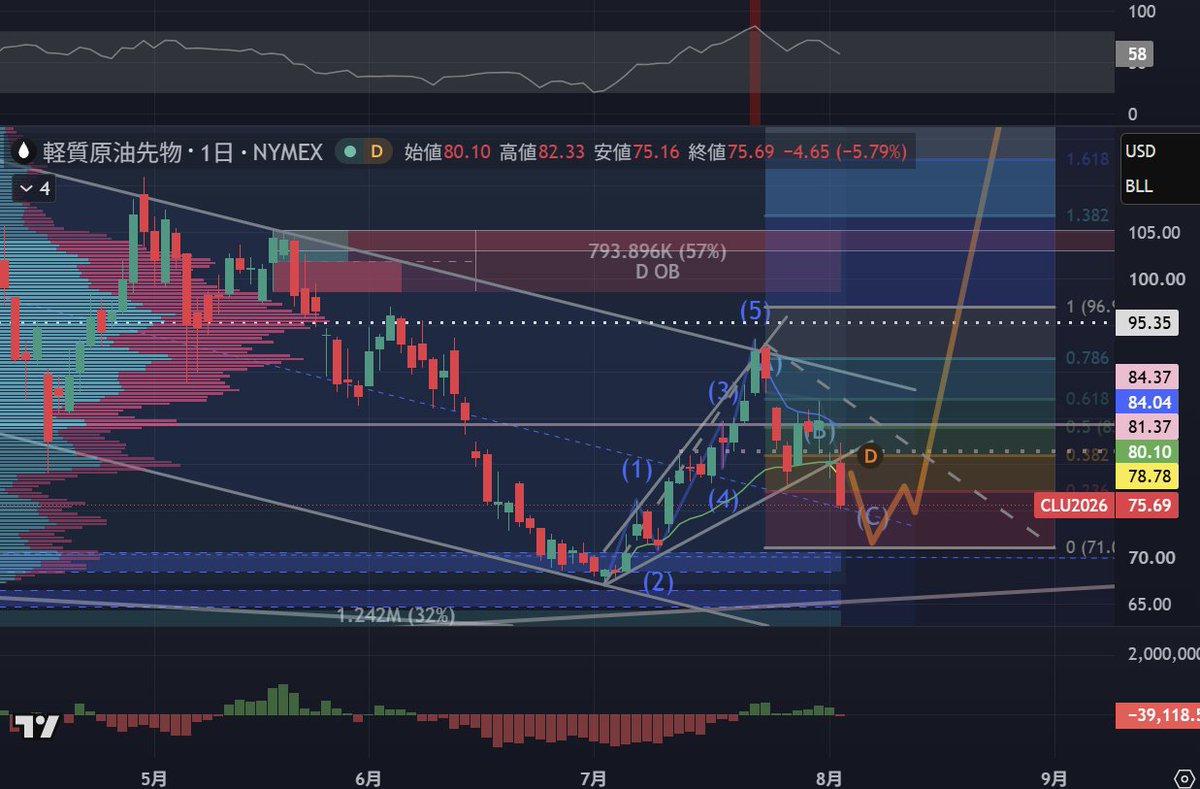
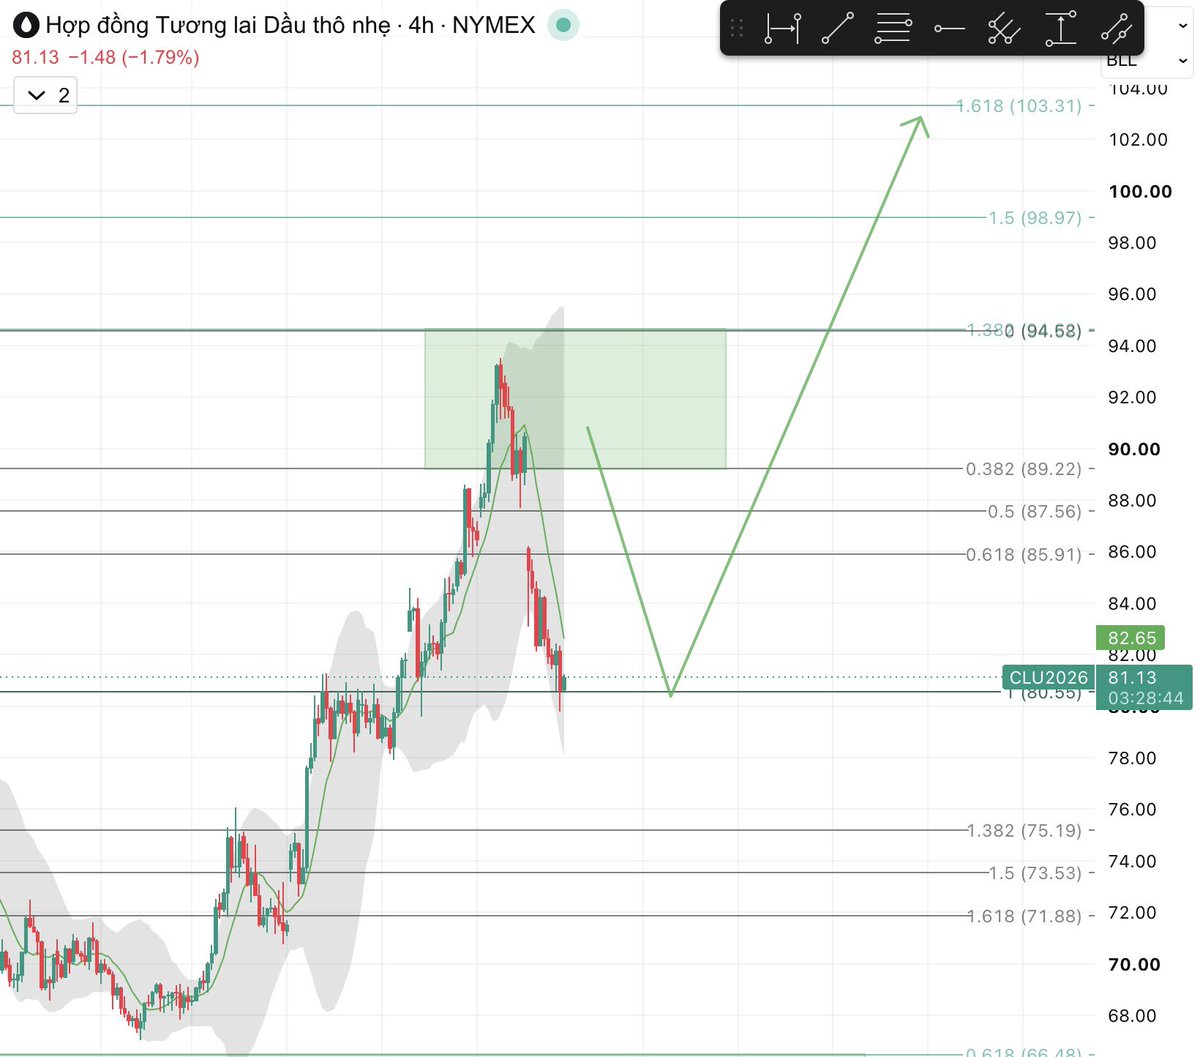
Oil could reach $140-$150 on the breakout.
If you still doubt that oil will go much, much higher, here is another big picture setup saying it will.
That is an 18-year, very probable, inverse h&s pattern for oil.
The established mass media narrative now is that inflation is coming down, growth will return shortly, unemployment will drop after summer, and that everything will be dandy again in the Fall.
Well, no.
Been saying for years that we will see at least $250-$300 oil during this commodities bull market. Raised that to $369 in the linked post below, in which also nailed the low for the right shoulder for the probable 18-year inverse h&s, at $58.40. Might raise the target even further later on.
Also, posted on oil backtesting the red pattern last month.
Since called the commodities bear market low 6 years ago, in real-time at the lows, I have been saying that this commodities bull market is the best opportunity you will ever have in life to get out of the rat race.
It is extremely important to make the best use of this commodities bull market, for many many reasons.
Which means, following the right people is absolutely vital. #joinus https://t.co/dZoc2yuE1z
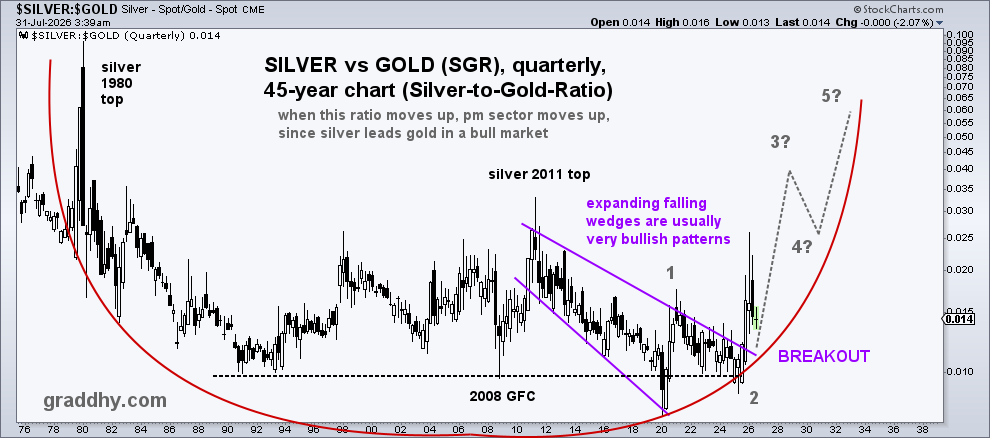
The massive, historical breakout for SGR above the 15-year purple bullish expanding falling wedge, did coincide with silver´s big move as expected.
The breakout means SGR has now starting the climb up the right side of the red 45-year rounded bottom/arc. This chart told us that silver was about to move big.
Been saying for years that SGR, which is the reverse GSR, has a cleaner pattern than GSR.
Said in the post linked below that "The chart is now ready.". And we now finally have the huge breakout.
Take in that it is a breakout from a 15-year (..!) expanding falling wedge. Usually a very bullish pattern. And, do note that this massive breakout is a starting move for this chart below, and not an ending move. We will still have small and big pullbacks though of course, like we have right now.
SGR is now backtesting on lower time frames.
It is vital to follow the right people. We nailed this move at the service all along. And we should nail the next one too.
#joinus at https://t.co/dZoc2yuE1z for real guidance, with real value
Somebody explain to me how oil isn't $150 / barrel right now?
Actually, we know the answer. Extreme paper manipulation. But that doesn't work forever...