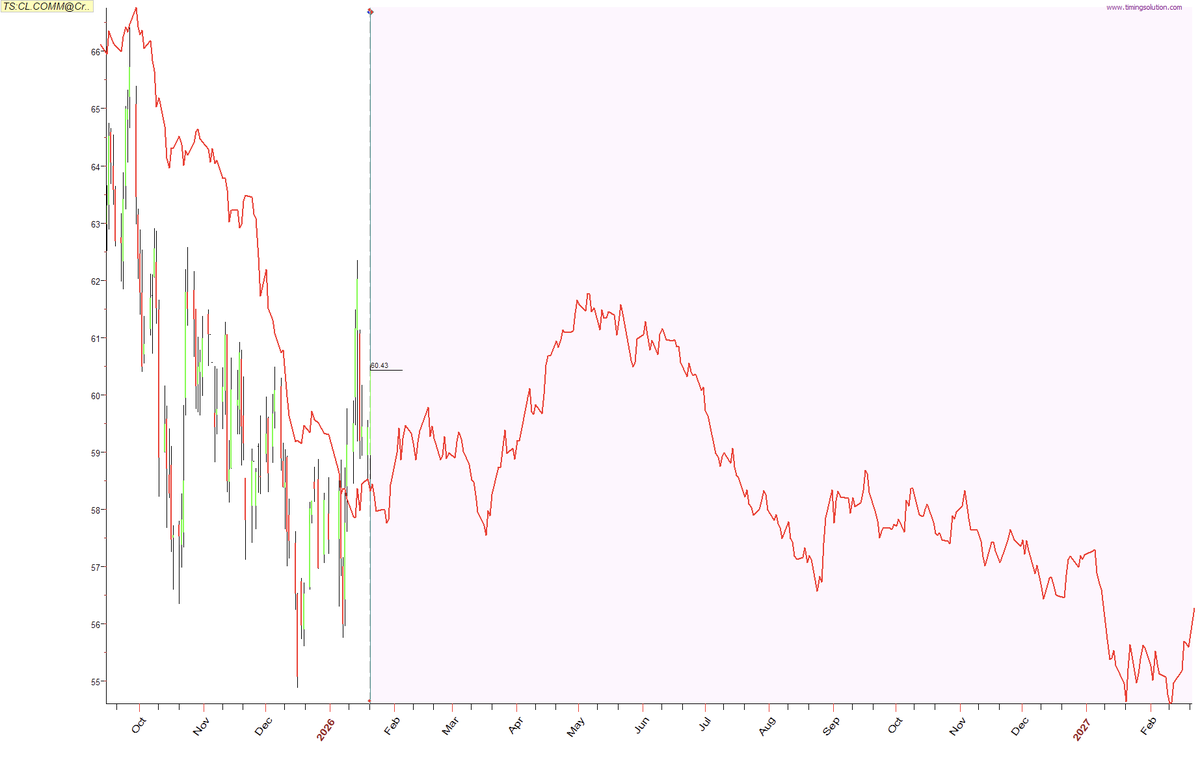
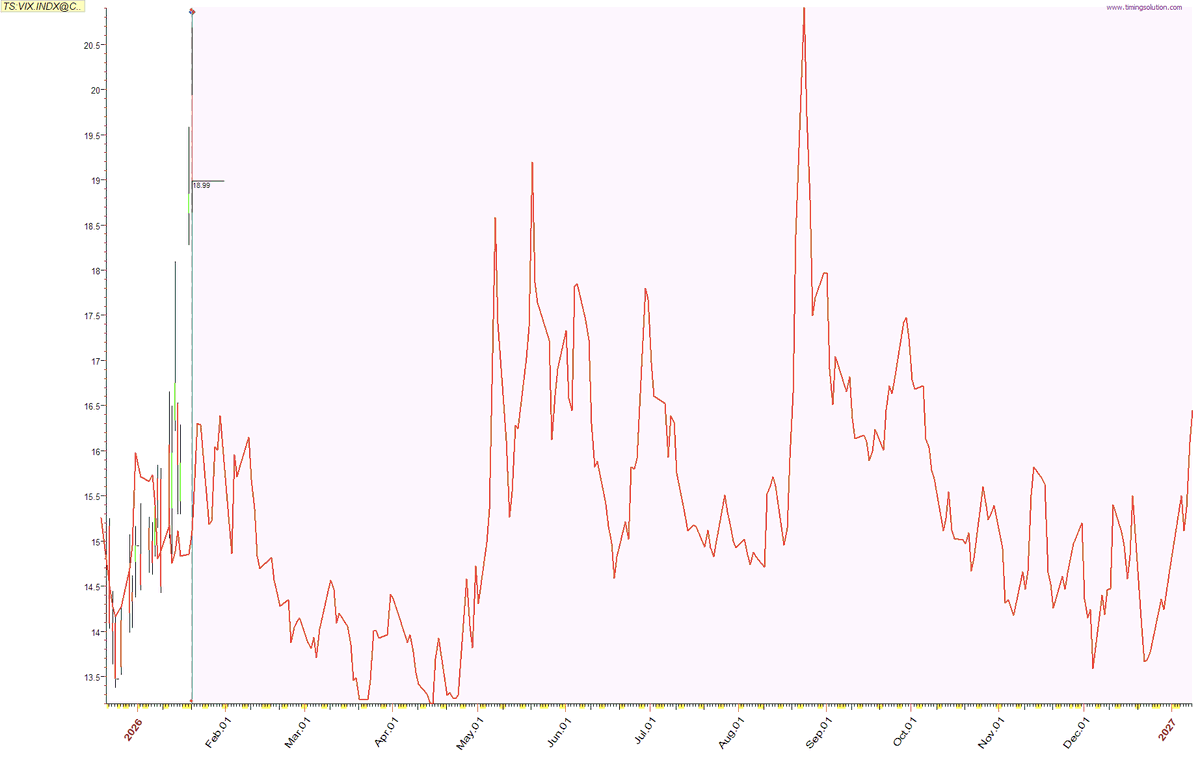
I have not posted in a while but here are my 2026 intermarket cycle forecasts.
These are broad brush stroke expectations of where certain products may trend in the year, made with some methodologies that Larry Williams uses.
Most of the 7yr & 3.5 year cycle forecasts from last year are still in play, anticipating a drawdown in 2026, which should be a long term BTD opportunity (similar to 2022), and up into 2028 & 2029.
I will not be updating and posting regularly.
Here is intermarket $SPX forecast for 2026
Cycle analysis suggests 2026 aligns with a 3.5 year trough, implying elevated downside and volatility risk, while rising inflation and potential Fed liquidity or fiscal responses could distort the timing and depth of the cycle low
See this post https://t.co/fWT2SJj2Gp and this https://t.co/1mJnOEcvI7 for examples of expectations
"Just be patient it will take more time [...] for CPI to rise"
Right now you can think of us as being in a classic fed easing window, if it weren't for tariff inflation expectations, we'd be seeing cuts.
This composite cycle chart of Sticky CPI has two components beneath it, a 5.5 year cycle in red, and a 42 month cycle in blue.
As of right now we're in a high time frame disinflation trend into ~Apr 2026 per the 5.5 year cycle
In the midst of this, the 42M cycle rises into the same period, suggesting from here on out, we'll see mini re-blips in inflation, while growth progressively weakens
With this information we can make some rough assumptions about the future - post April 2026, the re-inflation trend continues into 2028
At the same time, Real GDP is forecast to decline into June of 2026, and July of 2027.
This puts us in a clear stagflationary window between April of 2026 to 2028, where we expect to see higher levels of inflation (potentially 4-5%) and lower levels of growth.
Based on this simple analysis I believe we will see a deeper and longer recession than most anticipate, given the lag of the FFR and other factors on the economy.
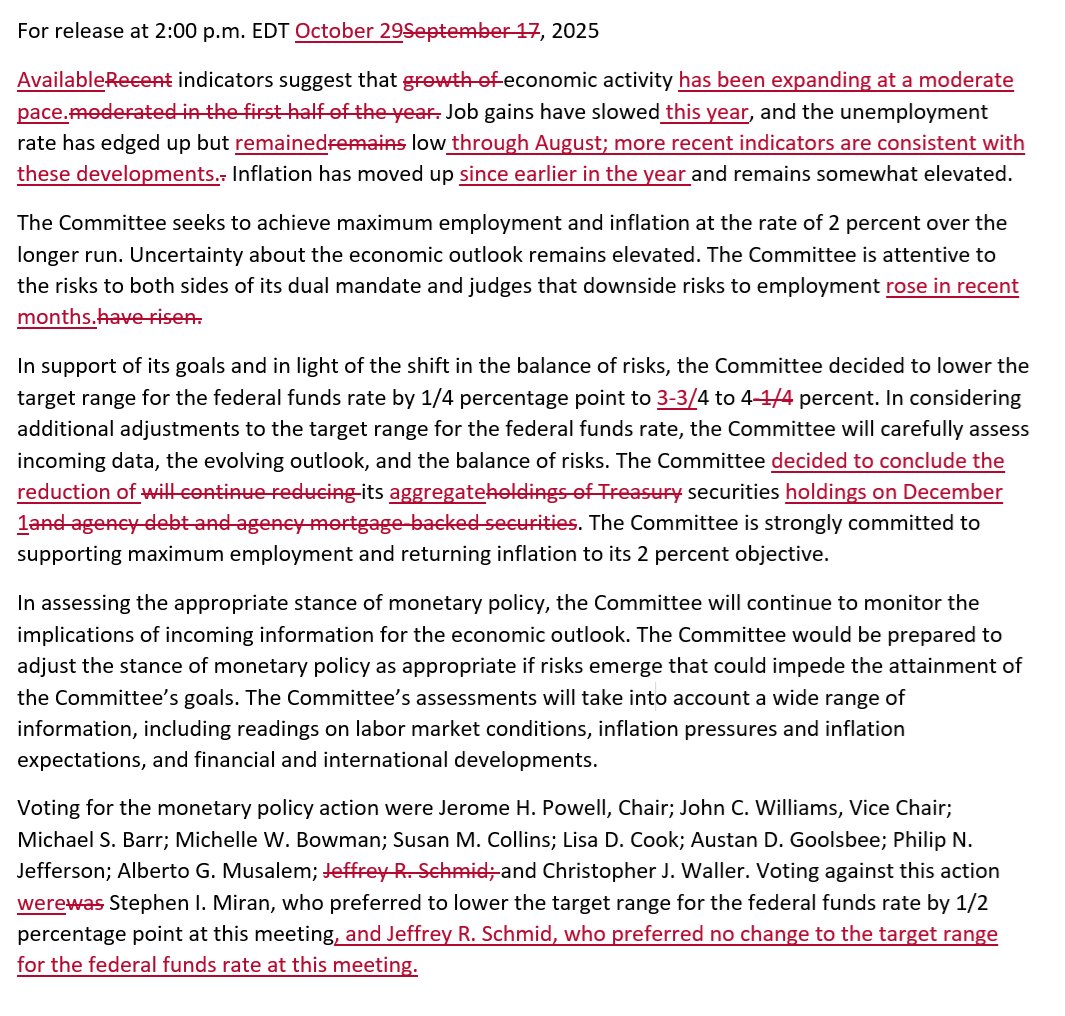
October FOMC decision:
-The Fed cut rates as expected by 25 bps.
-There were two dissents. Schmid favored no cut, and Miran wanted 50 bps.
-The Fed will end QT on Dec. 1. MBS redemptions will be invested into T-bills after that.
-The statement changes mostly mark to market the outlook, notwithstanding “available” data instead of “recent” data.
Predictive Analytic Models (PAM)
Robert P. Balan
Sep 29, 2025 3:37 PM (NY Market Open)
0DTE Outlook, September 25, 2025 --SPX pinned Like a Butterfly at 6670/75, 0DTE; range today expected to be 6645 - 6675
The Market Makers' gamma profile shown below is the mechanical blueprint for today's price action – -it shows both where price wants to go (6670 - 6675) and why it likely can't escape (massive positive gamma creating mean reversion).
The positive gamma creates the "gravity" that pulls price towards this level. Volatility compresses as we approach the pin at 6670/75.
(Source: @OptionsDepth)
The 6675 Deep-Dive Check – 6670/75 zone is a hard cap today
The 30-point range (6645-6675) is tight but could be tradeable (shorts from 6670/75 favored during early NY). The key is recognizing we're dealing with massive gamma that will compress volatility and create predictable pin behavior by NY close (likely at 6670/75).
Looking at the data:
110.76 GammaxOI at 6675 - astronomical for a single strike
93.72 GammaxOI at 6670 - second massive concentration
Combined, these create ~200+ gamma points of resistance
Why that kind of gamma resistance is nearly impossible to break:
Mechanical Reality: Every point higher requires dealers to sell exponentially more shares
Time Decay: After 2:00PM NY time, charm accelerates the pinning process at 6670/75
Volume Required: Would need exceptional volume to overwhelm the astronomical gamma (not happening on a Monday)
Any approach to 6675 is a gift to short. The gamma wall is too massive for a Monday 0DTE to overcome without extraordinary non-option market catalyst.
Think of 6675 as a concrete ceiling today - you might bump your head on it, but you're not breaking through (for very long).
There's heavy Customer put positions at 6620-6640 (extending left/negative side). Big Money drew a line in the sand right there at those levels.
(Source: @OptionsDepth)
Market players have spent $2.6 million in premium to defend 6640-6645. That's real money that won't be abandoned without a fight. The massive put volume shows institutions buying protection here, creating a natural floor.
If big money spent $2.6M to defend 6645, it's probably good, viable support.
Visit us at:
https://t.co/oDFi6w96b6
https://t.co/eFMrBBS7qY
S&P 500
How does the rally compare to history?
-The 4th strongest rally vs all other bulls (82, 09, 20 were >).
-The STRONGEST recovery excluding recessionary cases.
At 116 days w/o a 6% pullback, the rally has gone farther than all but two early-stage bulls (1966 & 1957).
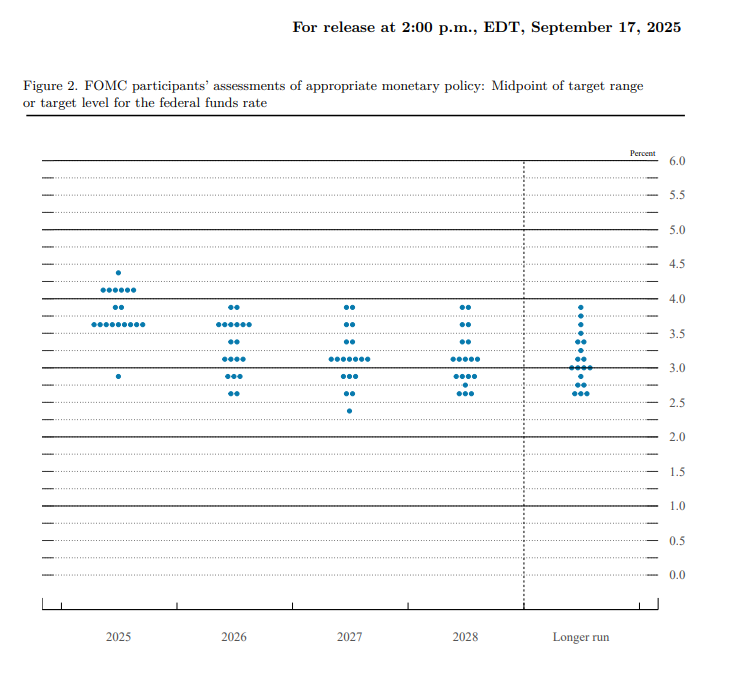
So the median Fomc participant raised the growth forecast for 25’— implying gdp at potential growth pace, or perhaps even higher given slowdown in immigration, in H2.
It also lowered the UR projection for 26’ and 27’.
And it is talking about downside risks to employment having increased.
I have not seen a meeting with so much contradictions.
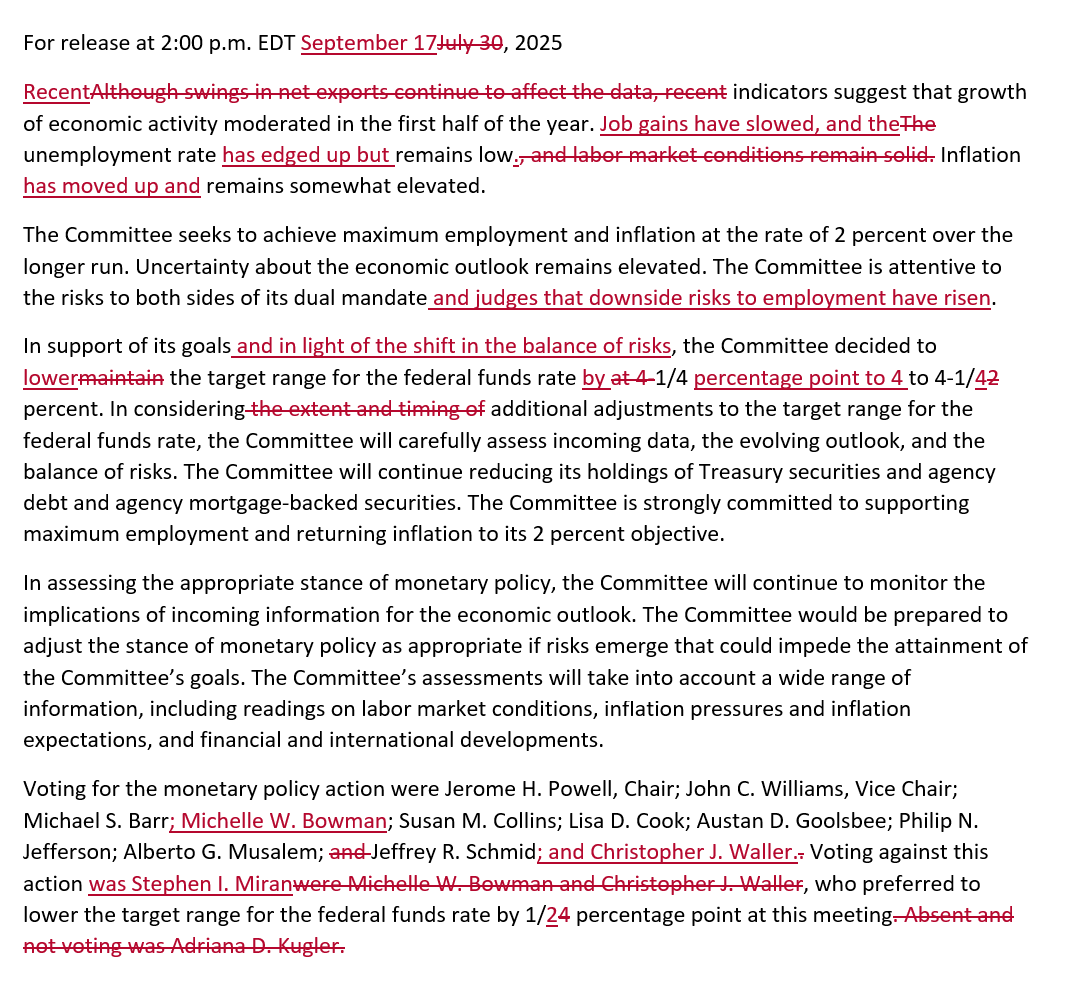
September FOMC
*The Fed cuts rates by 25 bps
*A narrow majority of officials pencil in a total of at least 3 cuts this year
*Statement changes are dovish
*Miran is the only dissent, for 50 bps
If the market is lower 2 weeks after a rate cut - it tends to finish much lower 1 year afterwards.
Something to watch post the FOMC meeting on Wednesday and the real concern in the data that we got for the last quarter century.
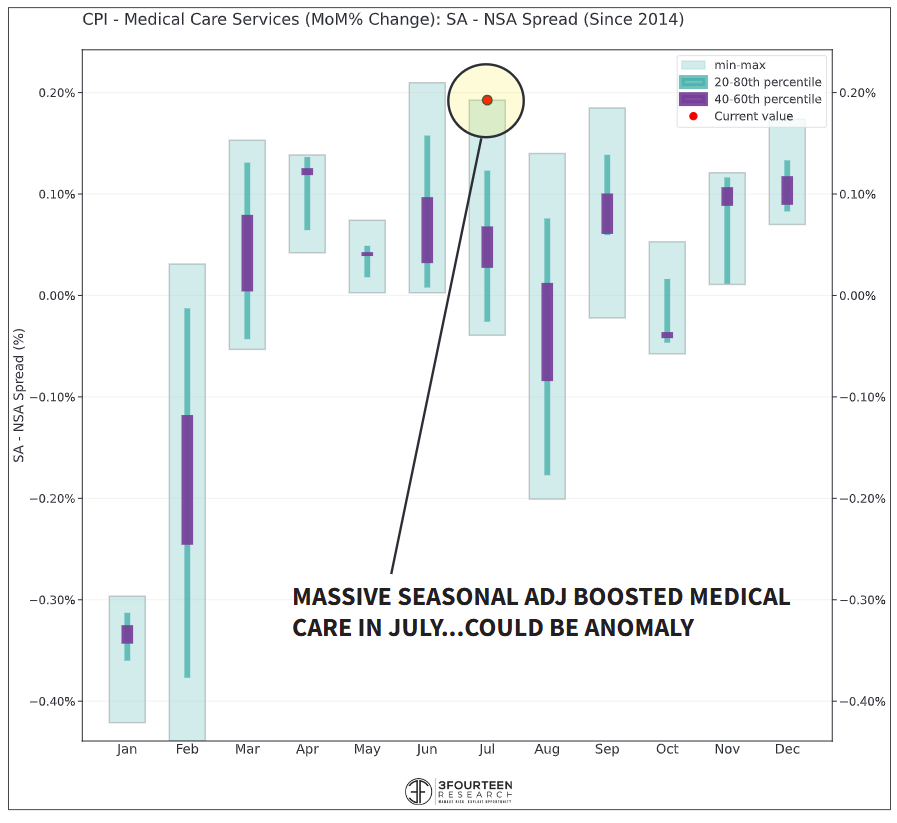
August CPI out this Thursday.
Two of the biggest surprise upside contributors last month - medical care + transportation services - had the largest positive July seasonal adjustment ever.
Watch for reversal of both...Cooler CPI would fuel 50-bp cut odds and push yields lower.


![traderDman's tweet photo. "Just be patient it will take more time [...] for CPI to rise"
Right now you can think of us as being in a classic fed easing window, if it weren't for tariff inflation expectations, we'd be seeing cuts.
This composite cycle chart of Sticky CPI has two components beneath it, a 5.5 year cycle in red, and a 42 month cycle in blue.
As of right now we're in a high time frame disinflation trend into ~Apr 2026 per the 5.5 year cycle
In the midst of this, the 42M cycle rises into the same period, suggesting from here on out, we'll see mini re-blips in inflation, while growth progressively weakens
With this information we can make some rough assumptions about the future - post April 2026, the re-inflation trend continues into 2028
At the same time, Real GDP is forecast to decline into June of 2026, and July of 2027.
This puts us in a clear stagflationary window between April of 2026 to 2028, where we expect to see higher levels of inflation (potentially 4-5%) and lower levels of growth.
Based on this simple analysis I believe we will see a deeper and longer recession than most anticipate, given the lag of the FFR and other factors on the economy.](https://pbs.twimg.com/media/GtLmSSfbgAAm5E8.png)





![traderDman's tweet photo. "Just be patient it will take more time [...] for CPI to rise"
Right now you can think of us as being in a classic fed easing window, if it weren't for tariff inflation expectations, we'd be seeing cuts.
This composite cycle chart of Sticky CPI has two components beneath it, a 5.5 year cycle in red, and a 42 month cycle in blue.
As of right now we're in a high time frame disinflation trend into ~Apr 2026 per the 5.5 year cycle
In the midst of this, the 42M cycle rises into the same period, suggesting from here on out, we'll see mini re-blips in inflation, while growth progressively weakens
With this information we can make some rough assumptions about the future - post April 2026, the re-inflation trend continues into 2028
At the same time, Real GDP is forecast to decline into June of 2026, and July of 2027.
This puts us in a clear stagflationary window between April of 2026 to 2028, where we expect to see higher levels of inflation (potentially 4-5%) and lower levels of growth.
Based on this simple analysis I believe we will see a deeper and longer recession than most anticipate, given the lag of the FFR and other factors on the economy.](https://pbs.twimg.com/media/GtLtdGgbAAACyaR.png)