Want to learn more about dot plots, Marimekko charts and isotypes? Check out the "One Chart at a Time" video series by @jschwabish | https://t.co/kIAj8OPMqv #dataviz
Explore police recorded crime retrieved from https://t.co/tNrznG4mzq in your local authority, ward or LSOA with our Crime Scanner app | https://t.co/e2Ug3E5RlM
A North-South divide in Internet engagement in Trafford? New #charticle using 2018 Internet User Classification data from the @CDRC_UK: https://t.co/776mGJjR8j
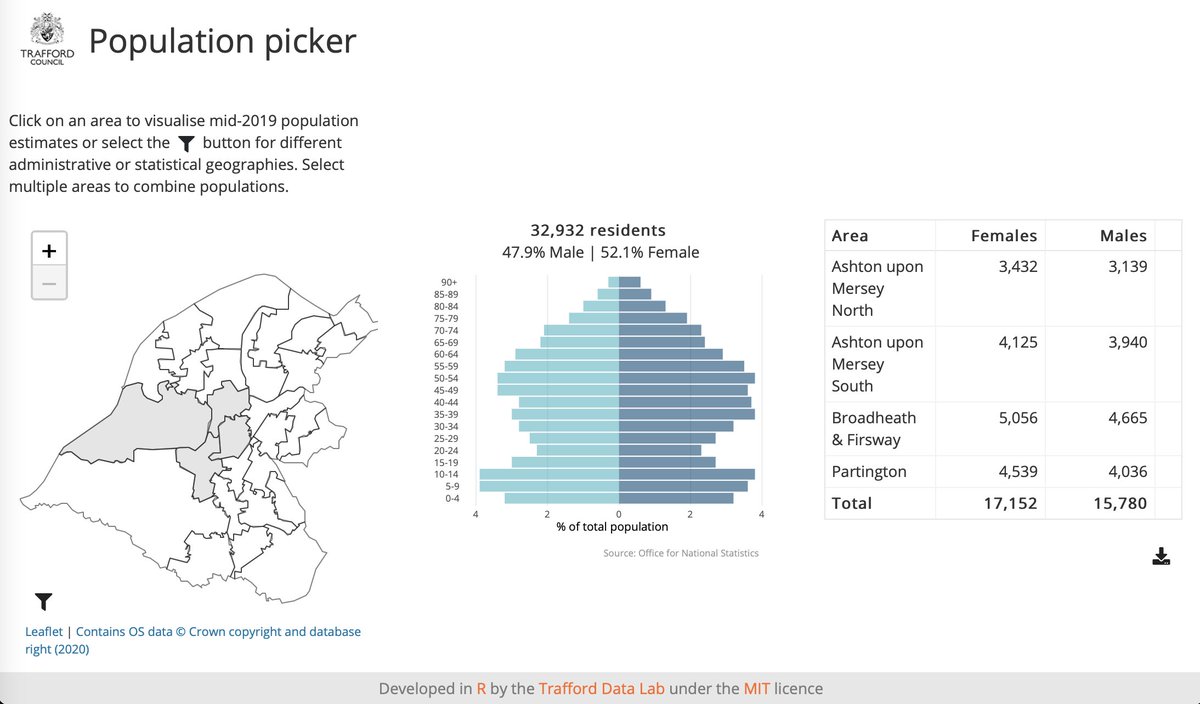
@bothness@ONS My team developed something similar in #rstats#shiny that might be useful: https://t.co/wOLZXrmNpp The code is here: https://t.co/jIVOa9au95
Minor update to our reachability plugin based on the fantastic API by @ors_news: v2.0.1 has updated attribution for OpenRouteService and OpenStreetMap. Please use the latest version! @MappingGM | https://t.co/JzXeRr8SNu
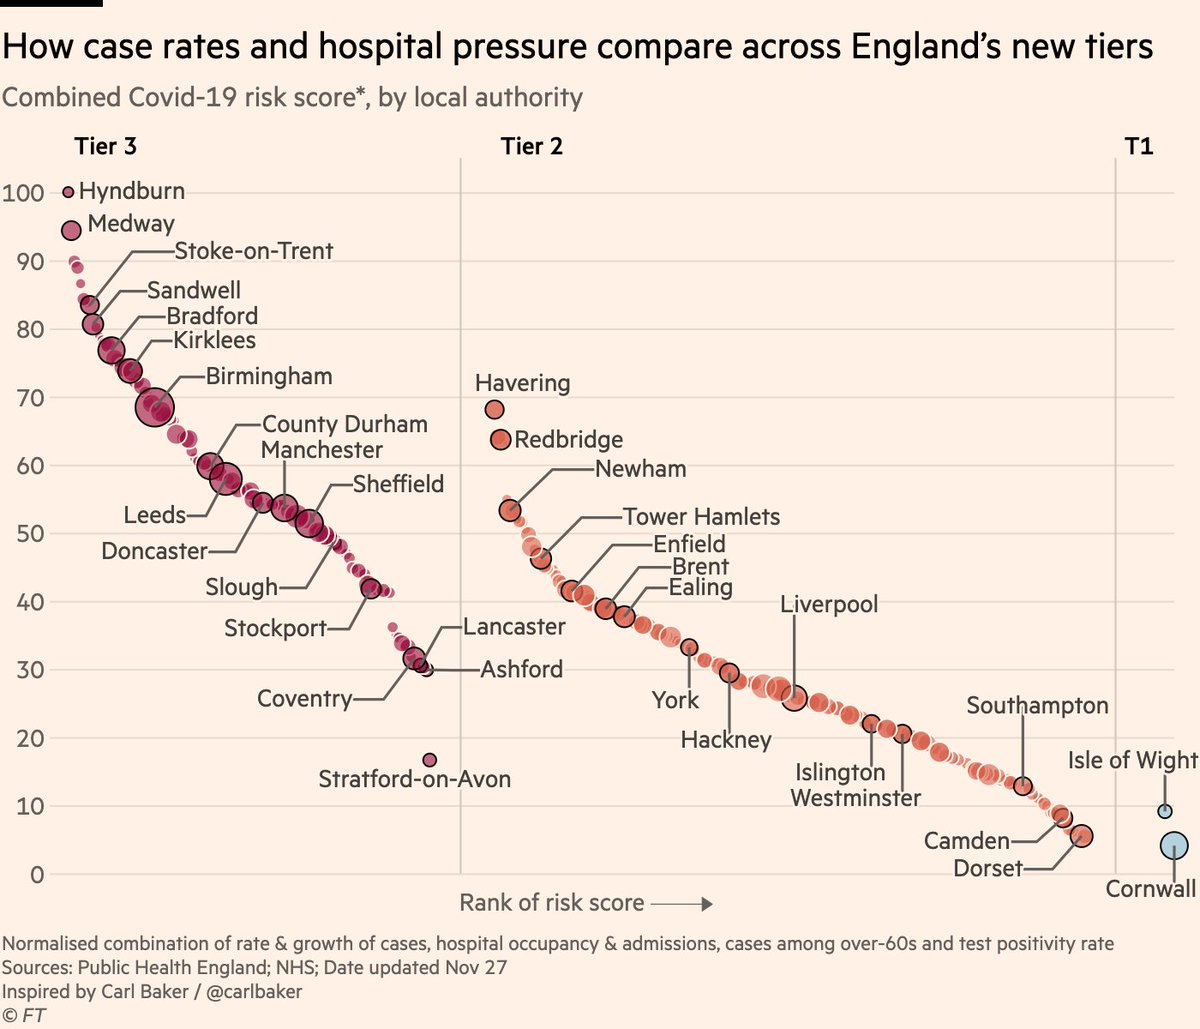
NEW: here’s the definitive chart on which parts of England have been hard-done-by or "let off" by the new tiers.
This one combines all the metrics the govt says it’s using:
• Cases (overall rate, rise or fall, and over-60s)
• Hospital occupancy & admissions
• Positivity rate
Hi @gmpolice - when will you start publishing crime data on https://t.co/tNrznG4mzq again? Police recorded crimes and outcomes have not been available since July 2019 #opendata