Berkshire's new CEO Greg Abel bought $15 million of stock Thursday.
His entire after-tax salary. He plans to repeat it every year for as long as he leads the company.
Berkshire also resumed buybacks for the first time since May 2024.
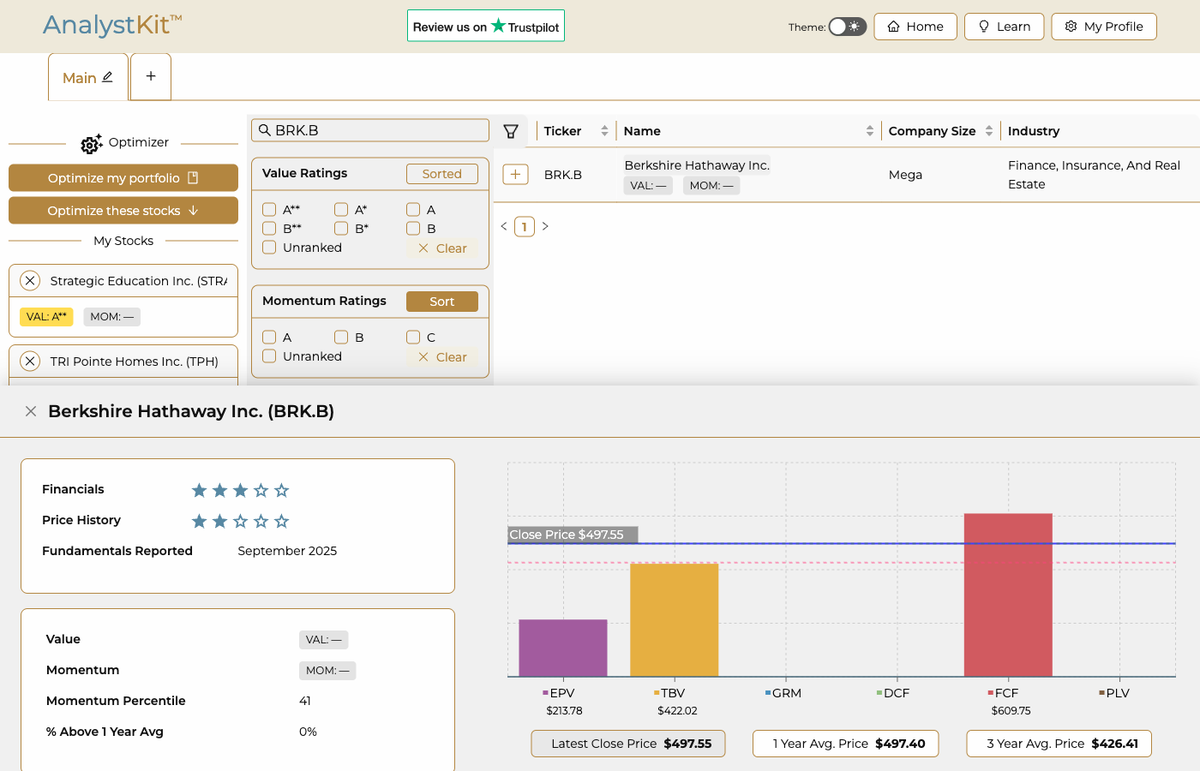
Pulled it up on AnalystKit. Financials 3/5. Price History 2/5.
Stock at $497. Right at its 1-year average.
EPV at $213. TBV at $422. FCF at $609.
FCF at $609 puts fair value above where the stock trades.
EPV at $213 puts it well below. TBV at $422 lands just under.
The models are split on where fair value sits.
The people running the company placed their bet.
See the full picture at https://t.co/Y5NPJdZgvE
Okta beat Q4. EPS $0.90 against $0.85. Revenue $761 million, up 11% year over year.
Shares fell on soft Q1 guidance, then recovered on strong FY27 outlook. Up 2% to $73.
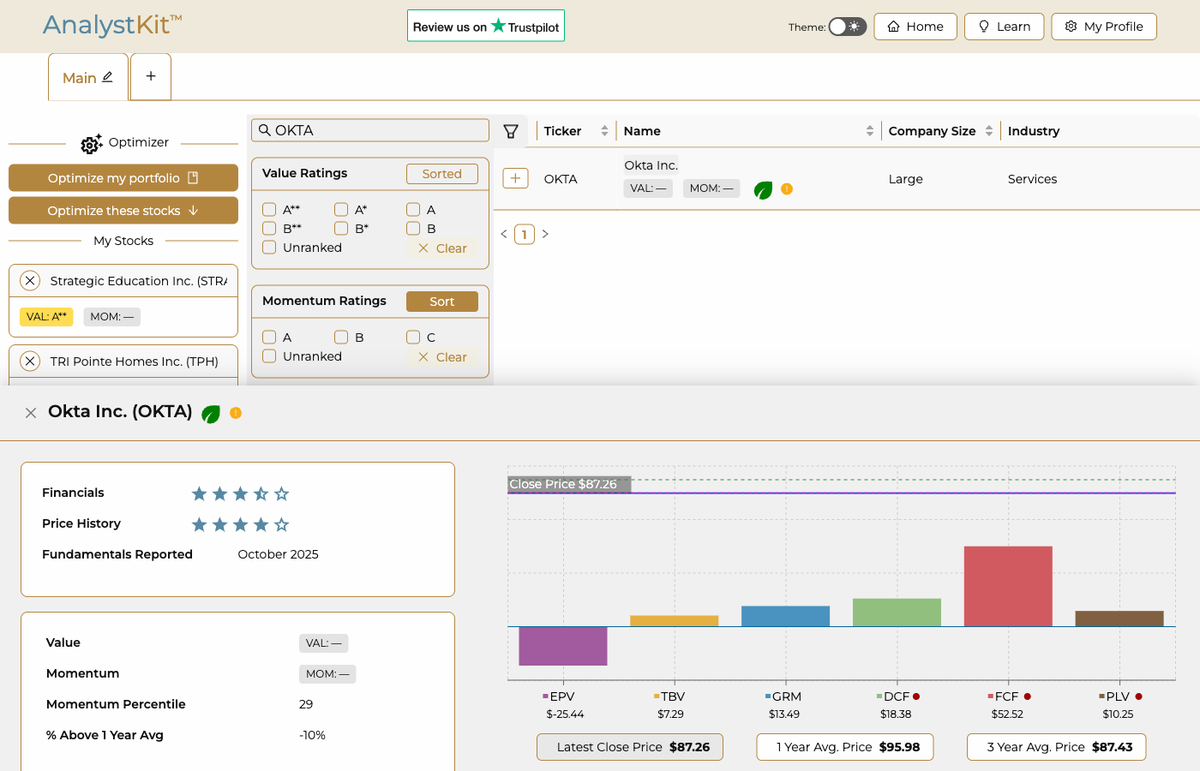
Pulled it up on AnalystKit. Financials 3/5. Price History 4/5.
Stock at $73. Ten percent below its 1-year average.
EPV at negative $25. TBV at $7. GRM at $13. DCF at $18. PLV at $10.
FCF at $52 is the most generous read. Still 30% below where the stock trades.
The quarter beat. The models price what the business earns today.
The gap is where the growth assumption lives.
See the full picture at https://t.co/Y5NPJdZgvE
The PCA point is the one that actually changes how you think about a book. Most people discover this after the correlated drawdown, not before.
One thing worth adding on GARCH: volatility clustering behaves differently in event-driven markets. In equities, β₁ mean-reverts. In prediction markets, a single resolution catalyst can take a market from 50% to 95% and park it there. The persistence parameter doesn't map the same way when the underlying process has a defined stopping time.
The martingale framing is right but incomplete. Probability accuracy is primary. Information speed is secondary. If you're faster at updating after a news event than the crowd, that compounds with accuracy in a different way.
Monte Carlo path analysis, EV+ gap detection, and position context are already built into Astera's Pro tools for exactly this workflow.
5,200 on the waitlist
https://t.co/W3ERq6Fj90
Kontoor Brands, parent of Wrangler and Lee jeans, jumped 19% this morning.
Revenue up 45.6%. The headline is doing a lot of work.
Strip out the Helly Hansen acquisition and an extra reporting week.
Organic growth: 2%.
Financials 1/5. Price History 2/5.
Stock at $67.46. 1-year average $68.05.
TBV at -$7.91. The acquisition loaded the balance sheet with enough intangibles to push tangible book negative.
DCF at $89 is the only model above the current price.
FCF at $70 was roughly where the stock traded before the news.
The quarter moved the market. The acquisition math is what the next few years will test.
See the full picture at https://t.co/Y5NPJdZgvE
Bank of America upgraded Tesla to Buy today. Price target $460. Stock jumped 3.5%.
Pulled it up on AnalystKit. Financials 2/5. Price History 1/5.
Stock at $417.44.
EPV at $9.72. TBV at $23.28. DCF at $37.02. FCF at $37.16.
BofA says robotaxis account for 52% of Tesla's valuation. That is a forecast, not a fundamental. The models price what Tesla is worth without it.
The $460 target and the $37 DCF are not disagreeing about the stock. They are disagreeing about the future.
See the full picture at https://t.co/Y5NPJdZgvE
Broadcom reported last night. AI revenue $8.4 billion. Up 106% year over year.
Q2 guidance came in at $22 billion against the $20.4 billion analysts expected.
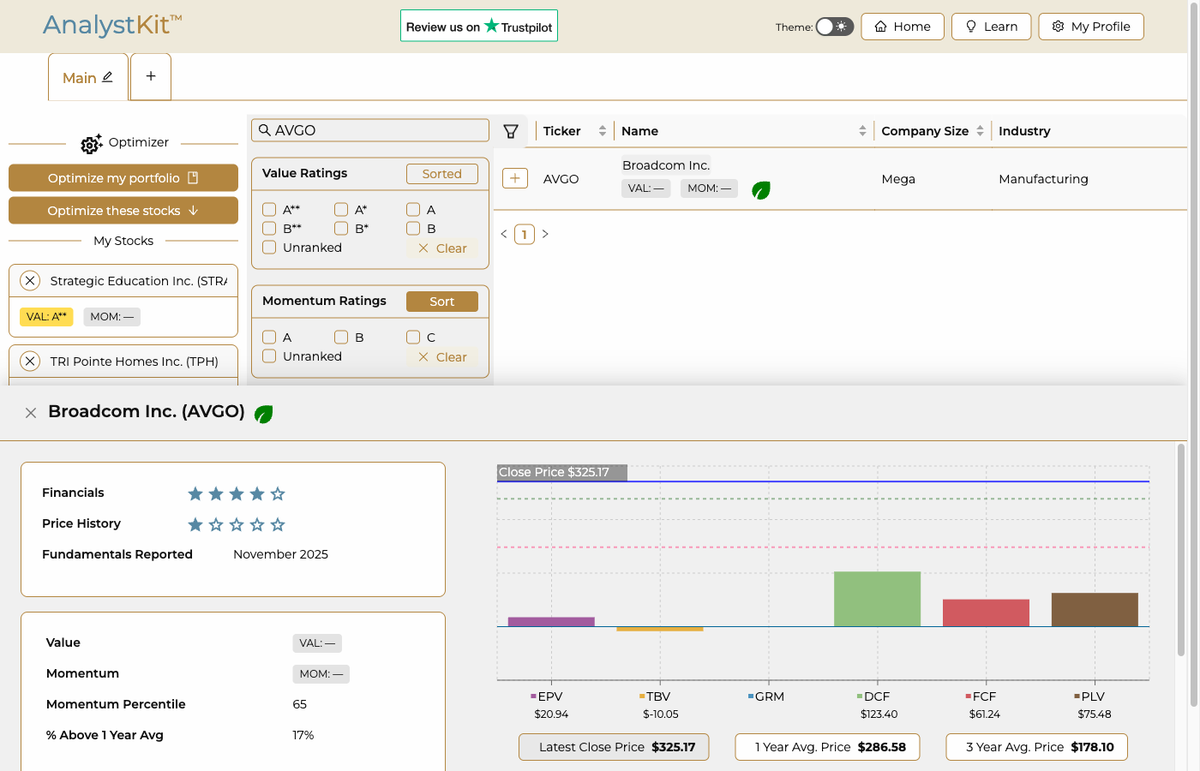
Pulled it up on AnalystKit. Financials 4/5. Price History 1/5.
Stock at $325. Seventeen percent above its 1-year average.
EPV at $21. TBV at negative $10. FCF at $61. PLV at $75.
DCF at $123, usually the most optimistic model, is still 62% below where the stock trades.
The business earns well. The models confirm it.
What the market is paying above that is a bet on the AI trajectory continuing at this pace.
See the full picture at https://t.co/Y5NPJdZgvE
Ross Stores reported 9% comps this quarter.
Revenue up 12%. Stock jumped 7.4%.
Pulled it up on AnalystKit. Financials 4/5. Price History 1/5.
Stock at $196.54. Thirty percent above its 1-year average.
EPV at $70. TBV at $18. GRM at $51. FCF at $80. PLV at $160.
DCF at $309 is the only model above where it trades.
Five of six models are below the current price. One is above.
The business earned today's move. Sustaining it from here is a different ask.
See the full picture at https://t.co/Y5NPJdZgvE
The Qmin and spoofing points are the ones that matter. Most MM writeups skip both.
The deeper issue: automated strategies keep running when conditions shift. Wrong market, spreads compressed, spoofing probe active. The bot doesn't know.
Astera's whale tracker flags large position changes as they happen. Sharpe AI surfaces the EV on both sides before you enter. You still make the call.
That's the difference between a bot and a tool.
5,200 on the waitlist
https://t.co/W3ERq6FQYy
Target reported this morning. EPS came in 13% above expectations.
The stock jumped 5%. Now trading 20% above its 1-year average.
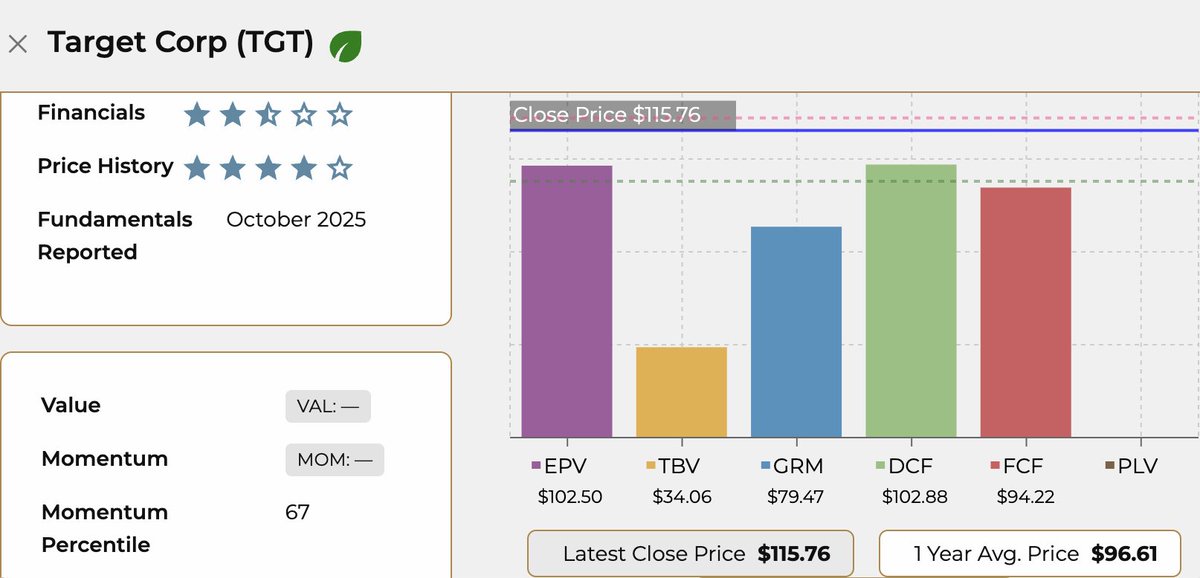
Financials 2/5. Price History 4/5.
Stock at $115.76. One-year average $96.61.
Every valuation model is below the current price.
EPV at $102. DCF at $102. FCF at $94. GRM at $79.
When every model sits below the stock price, it means the market is pricing in outcomes the fundamentals have not confirmed yet.
The quarter gave the market confidence. The fundamentals have yet to confirm it.
See the full picture at https://t.co/Y5NPJdZgvE
This is the right direction, but the “6 agents” part is not the hard problem. The hard problem is whether the system is trading real edge or just trading noise + survivorship.
A few things that decide if this is durable:
1) “Mispriced” needs a definition. Is it vs external reference price, cross-venue disagreement, or a model value? Otherwise it’s just “price moved later.”
2) 8–12c “entry edge” can disappear instantly after spreads, fills, and fee changes, especially in thin books.
3) The real moat is market selection and execution discipline: settlement clarity, liquidity scoring, and not getting trapped in ambiguous contracts.
4) The key metric is not wins, it’s whether it holds up through regime shifts and after the venue changes microstructure.
Agentic trading is real. The bar is making it robust enough that it survives when the easy edges compress.
Best Buy sold less this quarter. Revenue fell 1%. Comps fell 0.8%.
Margins improved. Costs got leaner. Stock jumped 6%.
Financials 2/5. Price History 4/5.
Stock at $65.80. Down 7% from its 1-year average.
EPV at $121 prices in the current earnings power holding.
DCF at $37 prices in the growth story not coming back.
FCF at $74 lands almost exactly where the stock is now.
One model says deeply undervalued. Two say overvalued. One roughly confirms the price.
That split is the whole story with Best Buy.
See the full picture at https://t.co/Y5NPJdZgvE
Monte Carlo is a great tool, but this tweet is mixing up “how to estimate probability” with “how to print PnL.”
Monte Carlo gives you an estimate with error that shrinks like 1/√N. That is about measurement, not edge. Also, for an event probability estimated by the sample mean, the variance scales as Var(p̂)=p(1−p)/N with max at p=0.5, not Np(1−p).
In prediction markets, the hard part is not simulating a probability, it’s whether your estimate is different from the market after fees, spreads, and slippage, and whether you can update faster than the crowd.
A few things to sanity-check before believing “200k in 2 weeks” claims:
1) What is the model for generating paths? If inputs are wrong, more simulations just produce a more confident wrong answer.
2) Where did the advantage come from: mispriced settlement language, cross-venue lag, or a superior data feed? Monte Carlo itself is not the advantage.
3) Was risk controlled? A strategy can look “never fails” until one tail event wipes weeks of gains.
If anything, the real takeaway is that prediction market trading is an engineering problem: data quality, calibration, and execution. Monte Carlo can be part of the stack, but it is not the stack.
PENN Entertainment jumped 14% this morning on a quarter that came in well above expectations.
Online sportsbook revenue up 102% on 24% less volume.
They made more money on fewer bets.
Pulled it up on AnalystKit. Financials 2/5, Price History 4/5.
Stock at $11.76. Down 31% from its 1-year average.
Most valuation models are in negative territory.
The free cash flow model is the only one showing positive value, putting PENN at $27.
Today was a good quarter. The gap back to where this stock was a year ago is a longer conversation.
See the full picture at https://t.co/Y5NPJdZgvE
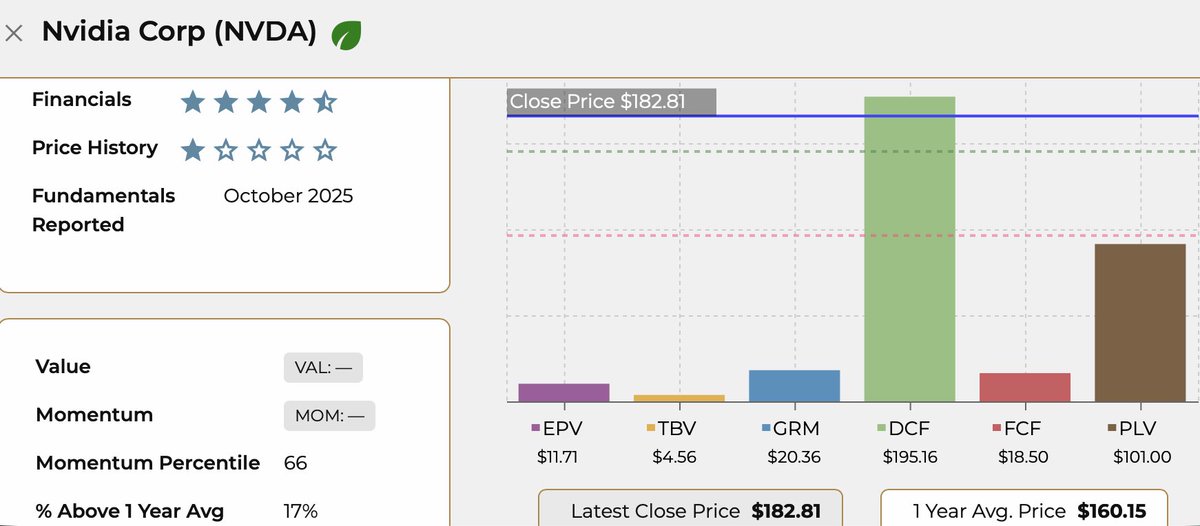
Nvidia reported $68 billion in revenue Wednesday night.
Morgan Stanley called it the largest, cleanest quarter in semiconductor history.
Stock fell 5% by Thursday morning.
Pulled it up on AnalystKit. Financials 4/5, Price History 1/5.
Stock at $182. Up 17% from its 1-year average.
If AI spending keeps accelerating: $195.
If growth stalls: $11.
Stock at $182.
The growth case barely clears where the stock already trades.
At $182, you're paying almost exactly what the optimistic math says it's worth.
No cushion built in.
See the full picture at https://t.co/Y5NPJdZgvE
TJX hit a new 52-week high today after reporting EPS up 28% and comps up 5%
The stock has been on a quiet run while most of retail struggled
Pulled it up on AnalystKit. Financials 3/5, Price History 1/5.
Trading at $154. DCF puts fair value at $218. But EPV sits at $47, FCF at $49.
When the models disagree that much it usually means the outcome depends heavily on assumptions about future growth holding up.
DCF is the optimistic read. The others are telling a more grounded story.
That gap is worth understanding before the 52-week high does the thinking for you.
See the full picture at https://t.co/Y5NPJdZgvE