I've built several income streams for myself over the last 6 years.
Here's a guide for those looking to build one/multiple of their own.
I'll assume you're starting with 0 streams of income and start there.
Likes and retweets are appreciated.
Fast, lift, sprint, stretch, and meditate.
Build, sell, write, create, invest, and own.
Read, reflect, love, seek truth, and ignore society.
Make these habits. Say no to everything else.
Avoid debt, jail, addiction, disgrace, shortcuts, and media.
Relax. Victory is assured.
The first rule of catching a bottom is:
Don’t try to catch a bottom!
2nd rule (if you can't help yourself): Wait for a higher low (not that these means bottoms, but, all bottoms will begin w/ one)
3rd rule: Wait for some moving average stability, preferably on a higher TF
Today one of the people I mentored for years completely blew up their account. They had $567k this morning and closed the day with only $115k left.
This was a great trader that recently had a lot of success and even built her own following. So what did she do wrong? 1/
Missing out altcoin pumps and free content is not enough?
See what I've got for u in The Nest.
We longed btc 6700s
71%+ wins (see results)💰
24/7 support
certified TA
free trials
Want my personal x10 altcoin list, free ebooks, hoodies & 50% limited discount?
Like, RT, DM me NOW!
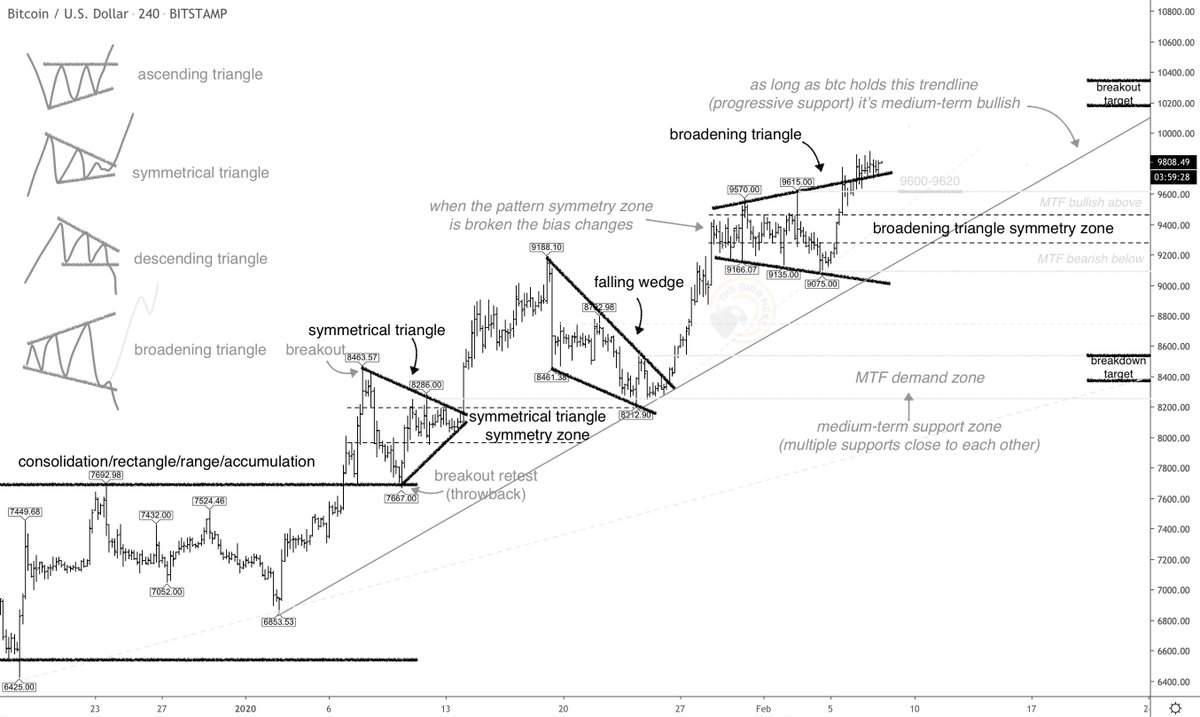
Took some time and prepared recent $btc chart patterns cheat sheet for all my new followers learning technical analysis.
I hope it helps and if you enjoy it just leave a like and share
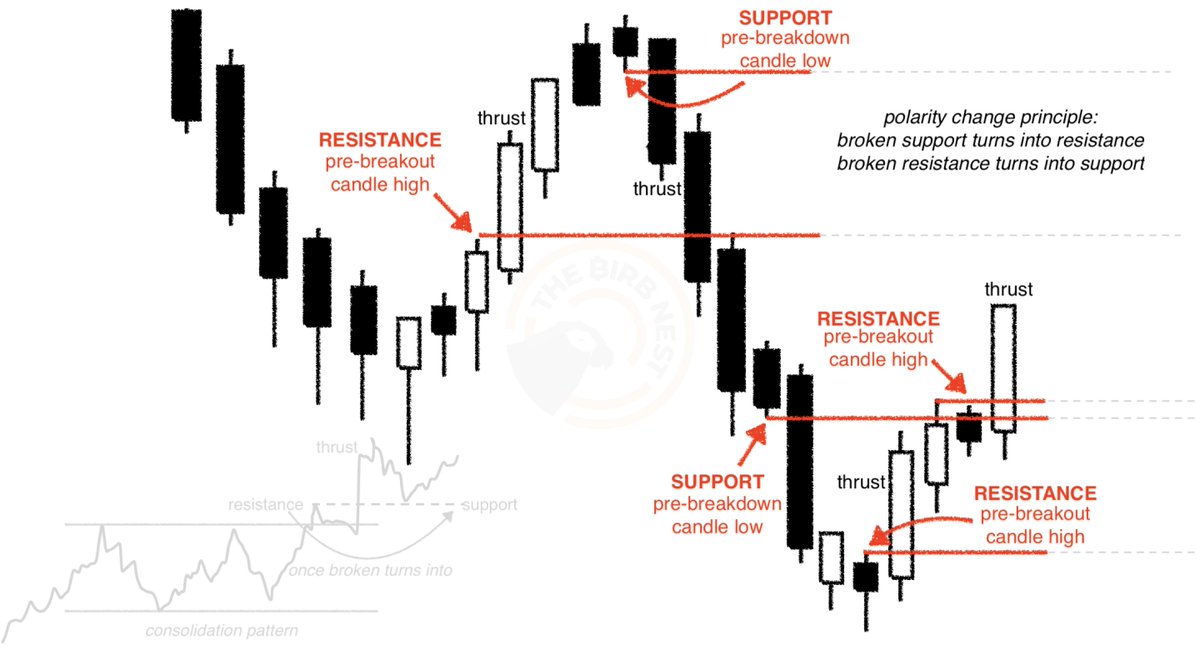
Tip: Key levels I always watch are pre-breakout highs & pre-breakdown lows. They later work as S/R. If a small candle is followed by a thrust it means the very last level to break was technically important. Thrusts appear due to local illiquidity at reversals. I hope it helps 🙂
#Bitcoin, #gold and #oil both increased in price as U.S.-Iran tensions escalated earlier this week, but are these assets correlated? https://t.co/3JqRblk4yv
A breakout that takes place from a chart pattern with horizontal boundaries will take out minor highs.
Whereas with symmetrical triangle, a chart pattern with diagonal boundaries, following the breakout price meets the minor high as resistance.