🚨 Language row at Mumbai's Andheri railway station after a passenger allegedly insisted railway staff speak only in Marathi.
The incident has sparked a fresh debate online.
#Mumbai#Mumbaikar#Maharashtra#WesternRailway#Marathi
A boy who had been paralyzed since childhood took a selfie in front of a wealthy man’s luxury car, just to experience a small moment of happiness.
What happened next was something he would never forget. More importantly, his faith was never paralyzed he realized that there are still kind and compassionate people in this world.
During the ongoing conservation works by ASI at the Trimbakeshwar Temple, Nashik, a stone Shivalinga was discovered during the desilting of the temple’s historic water tank, locally known as Amrit Kund.
The Shivalinga was found at the bottom of the tank while removing accumulated silt and debris.
This remarkable discovery highlights how conservation efforts continue to reveal and preserve India’s rich cultural and sacred heritage.
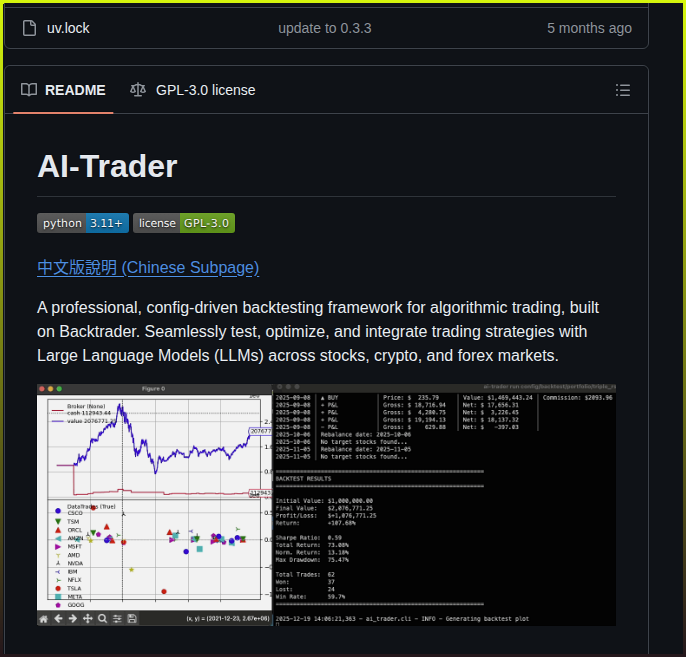
Now turn messy documents into structured knowledge with one command.
It's called Hyper-Extract.
Most RAG tools just chunk your PDFs and hope search works.
Hyper-Extract does something much crazier:
It turns unstructured text into:
• Knowledge graphs
• Hypergraphs
• Temporal graphs
• Spatial graphs
• Spatio-temporal graphs
• Strongly typed data models
• Obsidian vaults
• MCP-ready knowledge bases
So instead of asking an AI to “read this report,” you can turn the report into an actual knowledge system.
Use cases:
→ Turn papers into research graphs
→ Extract companies, people, metrics, and risks from earnings reports
→ Build searchable knowledge bases from private docs
→ Run it locally with vLLM so your data stays on your machine
→ Query the extracted knowledge from Claude Desktop or IDE agents through MCP
It also comes with 80+ YAML templates across finance, legal, medical, industry, and general domains.
This is not just document extraction.
This is what RAG looks like when it grows a spine.
Repo: https://t.co/nXW6QxkLwy
🚀 **30+ Future Multibagger Stocks | 8 Mega Themes for 2026-2035**
The biggest wealth creators of the next decade may emerge from sectors benefiting from structural growth, government support, and massive capital expenditure.
**1️⃣ AI & Data Centers 📡**
India's data center capacity is expected to grow rapidly due to AI, cloud computing, 5G, and digital transformation.
**2️⃣ Power & Smart Metering ⚡**
Rising electricity demand, renewable integration, transmission upgrades, and smart meter rollout are creating long-term opportunities.
**3️⃣ Semiconductors 💻**
India Semiconductor Mission, AI adoption, EV growth, electronics manufacturing, and China+1 strategy can drive sector expansion.
**4️⃣ Water Infrastructure 💧**
Data centers, semiconductor fabs, urbanization, wastewater treatment, and Jal Jeevan Mission are increasing demand for water solutions.
**5️⃣ Recycling & Critical Minerals ♻️**
EV batteries, electronics manufacturing, e-waste recycling, and critical mineral demand are becoming strategic growth areas.
**6️⃣ Specialty Chemicals 🧪**
Semiconductors, battery materials, electronics manufacturing, and import substitution are creating new opportunities for Indian chemical companies.
**7️⃣ Defence, Drones & Future Warfare 🛡️**
Atmanirbhar Bharat, defence exports, electronic warfare, anti-drone systems, and rising defence budgets support long-term growth.
**8️⃣ EV & Auto Ancillaries 🚗**
EV adoption, vehicle electronics, premiumization, ethanol blending, and auto component exports continue to strengthen the sector.
⭐ **Key Stocks Covered**
📡 AI: Anant Raj, Netweb, E2E, Aurionpro
⚡ Power: TARIL, HPL Electric, Techno Electric, Servotech
💻 Semiconductors: Kaynes, Moschip, Syrma SGS, CG Power
💧 Water: VA Tech Wabag, Ion Exchange, SPML Infra, Jindal Saw
♻️ Recycling: Gravita, POCL, CMR Green, Eco Recycling
🧪 Chemicals: Balaji Amines, Tatva Chintan, Clean Science, Indo Amines
🛡️ Defence: Zen Tech, Paras Defence, Data Patterns, Astra Microwave, GRSE
🚗 EV: Uno Minda, Lumax, JBM Auto, Pricol, Minda Corp, Sandhar
📈 Themes Create Wealth
📈 Narratives Change Industries
📈 Patience Creates Multibaggers
💬 Which theme are you most bullish on for the next decade?
❤️ Like | 🔄 Repost | 💬 Comment
#MultibaggerStocks #StockMarketIndia #Investing #AI #DataCenter #Semiconductor #DefenceStocks #EVStocks #WaterInfra #SpecialtyChemicals #MakeInIndia #SmallCapStocks #MidCapStocks #Chartguruji
I'm shocked more people aren't replacing their entire SDR workflow with Claude Skills.
I shared this with a GTM engineer still rebuilding context from scratch every session... they ran /gtm-memory-builder once and never re-explained their ICP again.
All you need is Claude Code and 1 session to set up the full library.
Like this post + reply "Agents" and I'll send you the complete skill library for free.
(Including every SKILL.md file written out in full across 130+ skills.)
Must follow to receive the DM.
Taking this down in 48 hours.
90% of AI agent tutorials on YouTube are just recycled fluff.
After building 47 AI agents with n8n + Claude, I realized most “experts” make it way more complicated than it needs to be.
The truth?
A few well-crafted prompts can do more than hours of tutorials.
Here are the 3 prompts I use that make building AI agents dramatically easier.
Save this thread 🔖
Bonus: Comment “Agent” and I’ll DM you the full list.
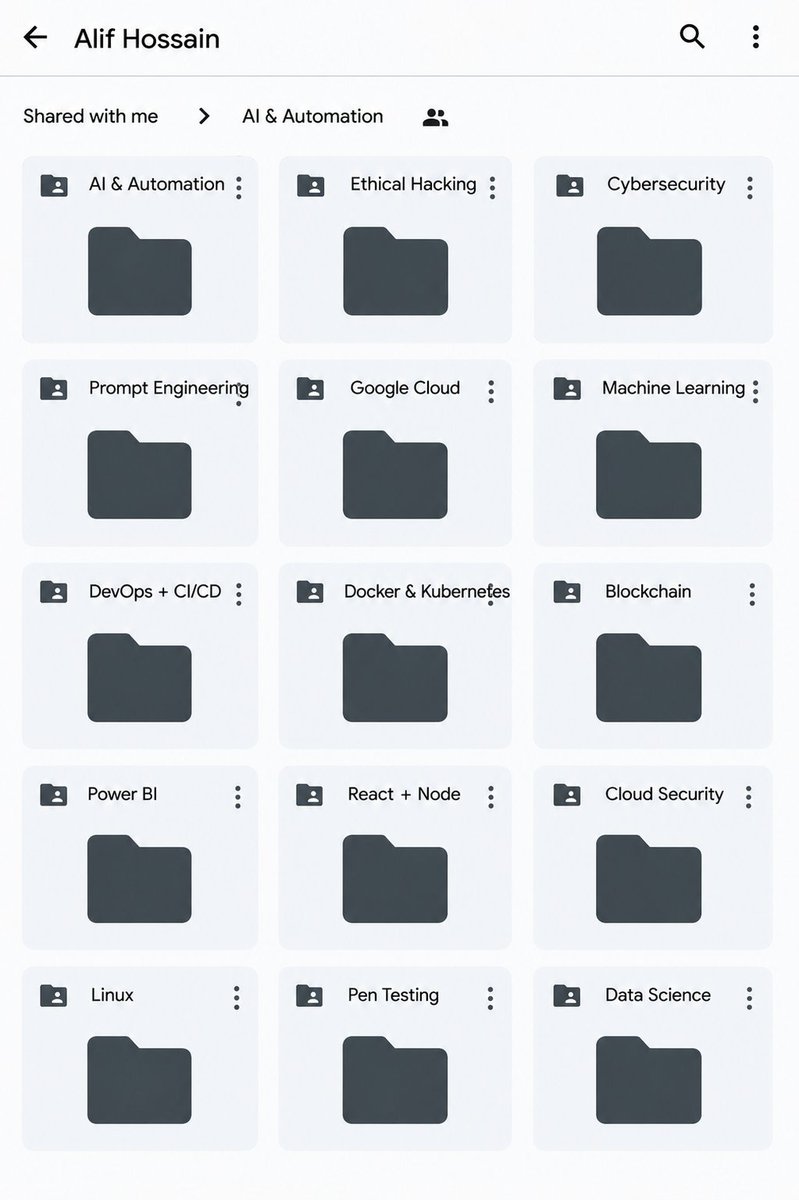
All Paid Courses (Free for First 4500 People)
𝗣𝗮𝗶𝗱 𝗖𝗼𝘂𝗿𝘀𝗲 𝗙𝗥𝗘𝗘 (PART - 3)
1. Artificial Intelligence
2. Machine Learning
3. Prompt Engineering
4. Claude,Chatgpt,Grok
5. Data Analytics
6. AWS Certified
7. Data Science
8. BIG DATA
9. Python
10. Ethical Hacking
(72 Hours only )
Like + RT + comment ' Drive '
Must Follow me so I can DM you.
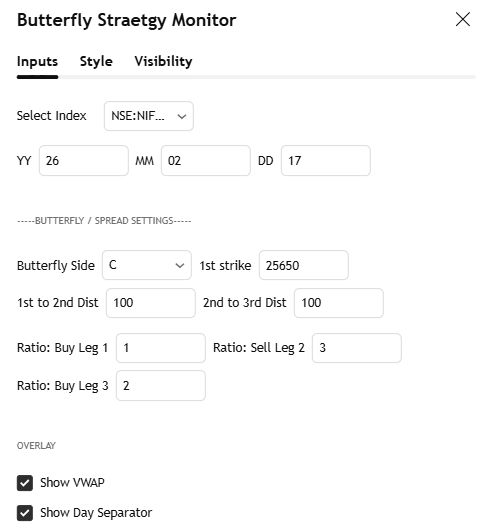
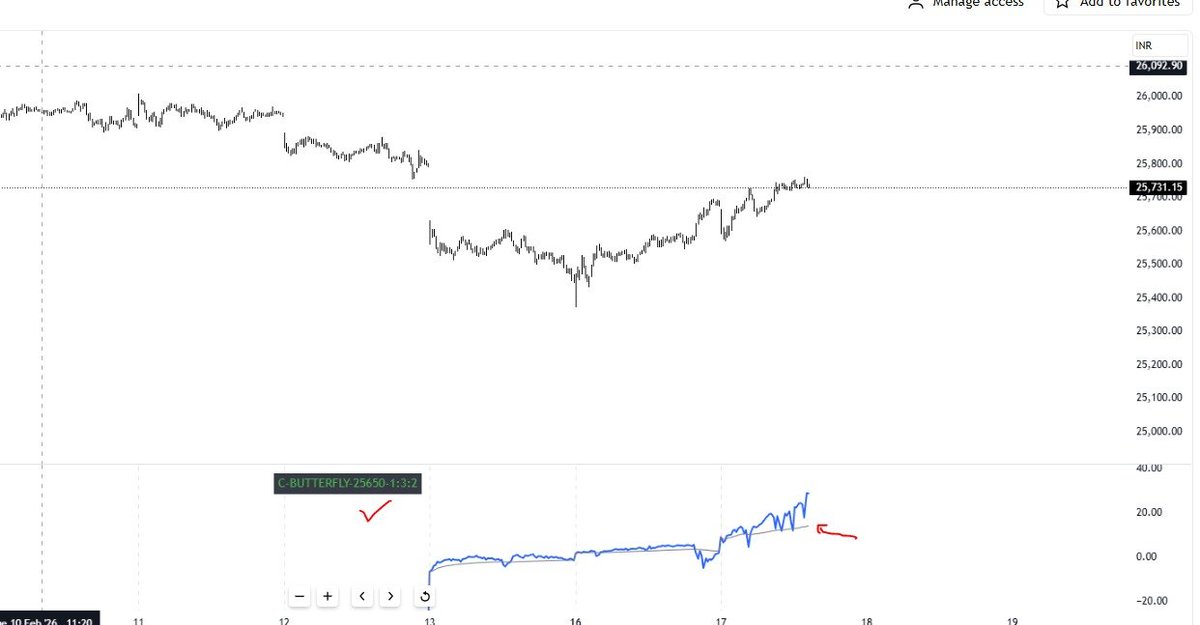
Tracking Butterfly spreads shouldn’t feel like a math exam. 🦋📈
Efficient monitoring = Better exits. 🎯
Many asked how I track Butterfly strategy prices alongside the Index. I’ve coded it into a TradingView script for you.
No more switching tabs or manual calculations.
Want access?
1. Like & RT
2.📝 Apply for free access here: https://t.co/U5k2SfITBO
📩 Access granted in 24hrs!
Let's trade with an edge.
Input details : How it looks on chart