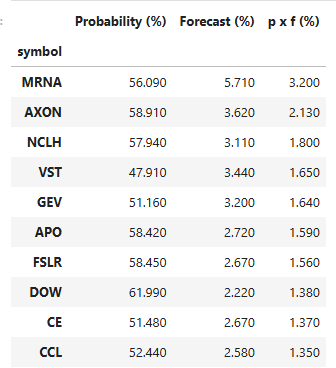
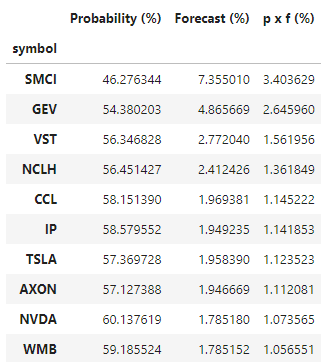
Current month was not good for my quant model, there was two big gap downs (VST and GEV) which ate all the returns generated and portfolio ended flat (SP500 ~2.9% up). Here are is the new list based on my ML model
What a black Monday and true regime change. My quant portfolio holds GEV and VST. The portfolio gave back all the returns ytd and then some. I don't understand the reactions. Both will be sold at the close.
I have read that it's "good strategy" to buy when RSI show over sold (crosses below 30) and exit when market is over bought (crosses above 70). Allowing some leverage this can be a good strategy, which has beaten SPY buy and hold. But doing other way around is better and safer.
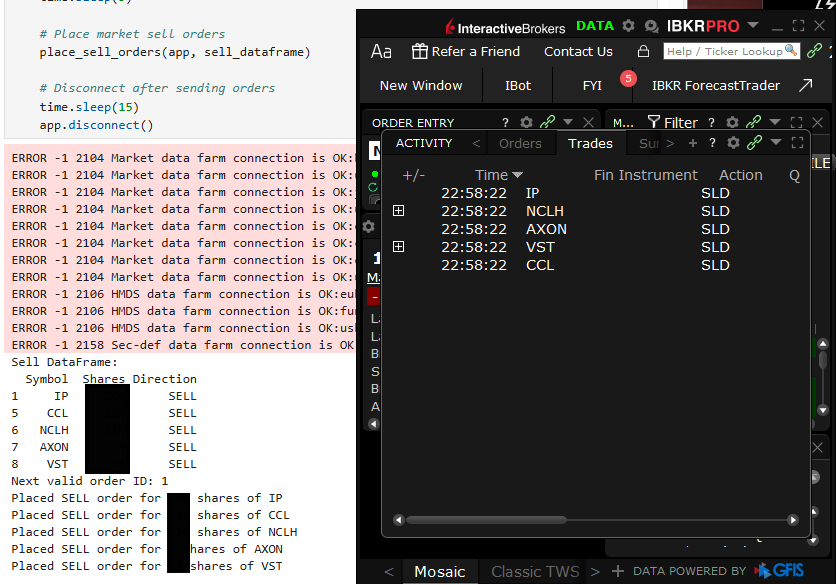
Today was a true nose bleed day for my quant portfolio and multiple sales were done according to risk management plan (trailing stop at close). All sales handled through python and IBAPI.
Some the key statistics of my quality portfolio (at least as I understand quality). High returns, high growth, good balance sheet and reasonable valuation. It's hard to find stocks with all the aspects in place.
Based on my ML model, these are the most likely high performers in the next month. Last group of selection made 2% compared to SPY as benchmark, which lost ~2.5%. Not an investment advice.
This year I have spent close to 8 months to build a robust quantitative trading process, which rely on machine learning. This has been quite an effort and the process has been build piece by piece.
Christmas sell off on-going on after the FED's decision to cut rates and new inflation guidance for 2025. Last stock of my ML based portfolio will be sold at the close. Portfolio +2.0% in December, SPY -2.4 % MTD.
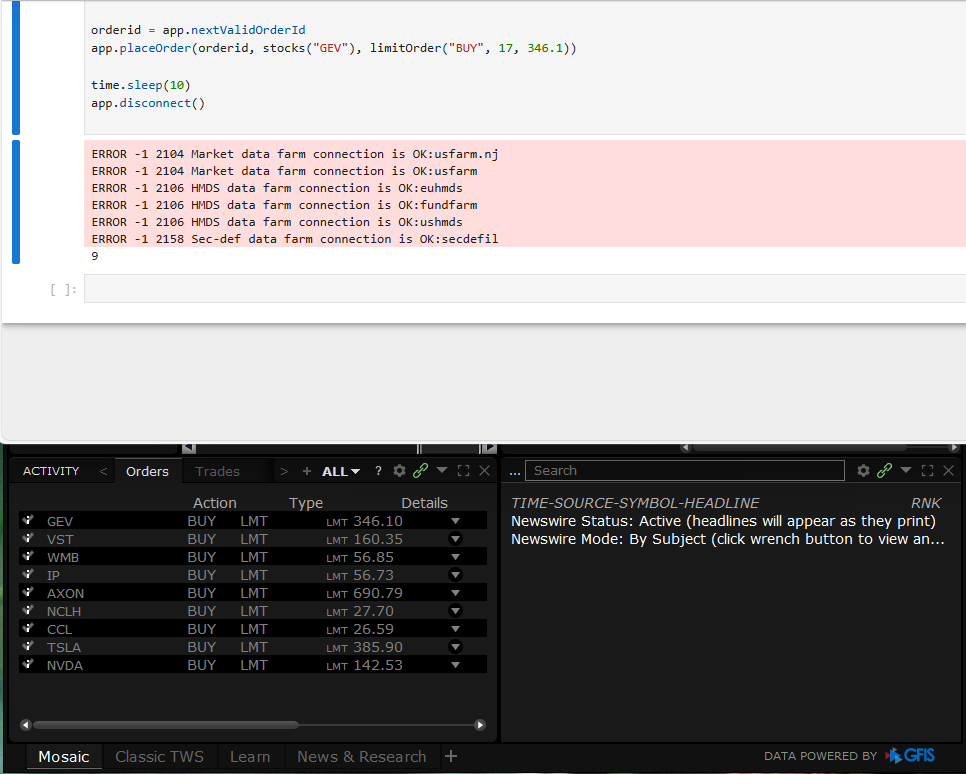
Big issue in systematic trading is good execution and high level of automation and quick execution are preferred. Today took the first step and send some orders from python using IBAPI to IB (paper trading for now, but same procedure for live account). Still work to do
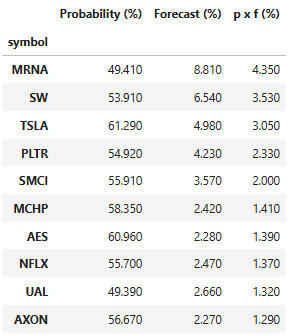
Based on ML model, these 10 stocks have the highest probability weighted forecasted return for December. Not an investment advice. Probability = up by the end of the month, forecast = forecasted return for the upcoming month and p x f = probability weighted return forecast.
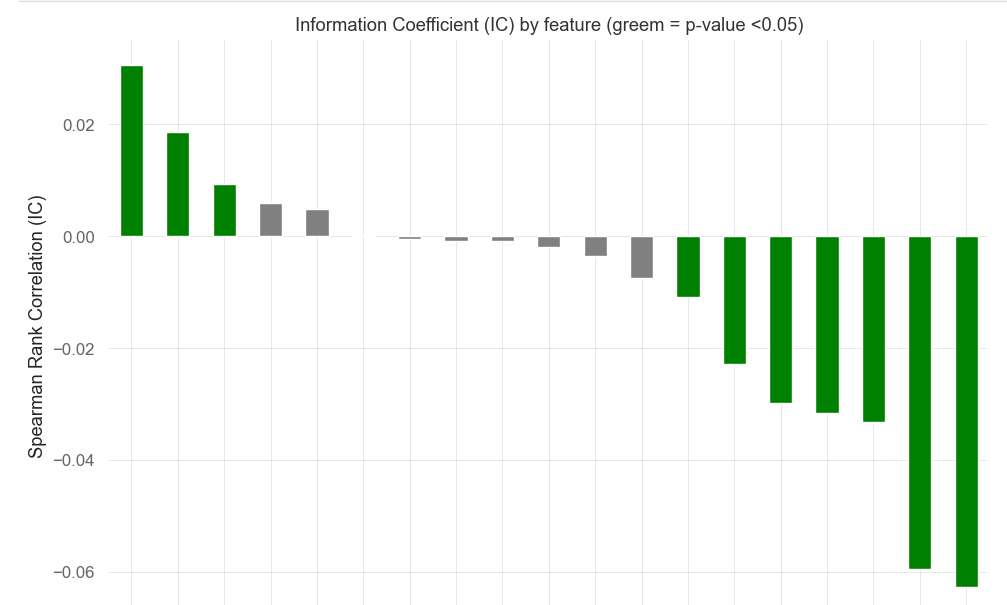
Besides analysing feature importance i.e. using SHAP values, understanding information coefficients (spearman rank correlation) by feature makes sure that the ML model will be robust
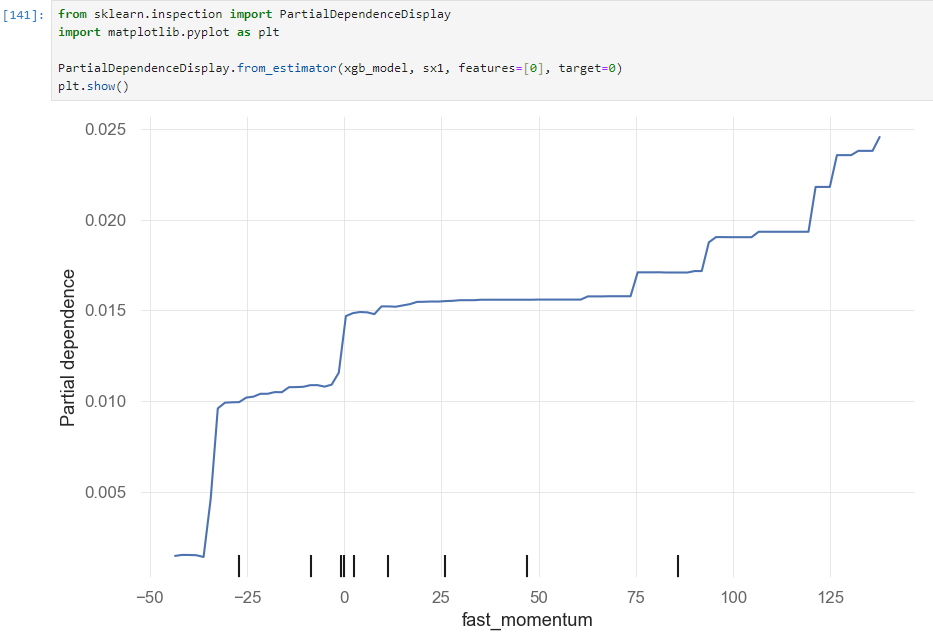
Machine learning doesn't have to be a black-box. For example partial dependence plot is a nice way to see how each of your feature's impact. Higher the short term momentum, higher the expected return for the next month.
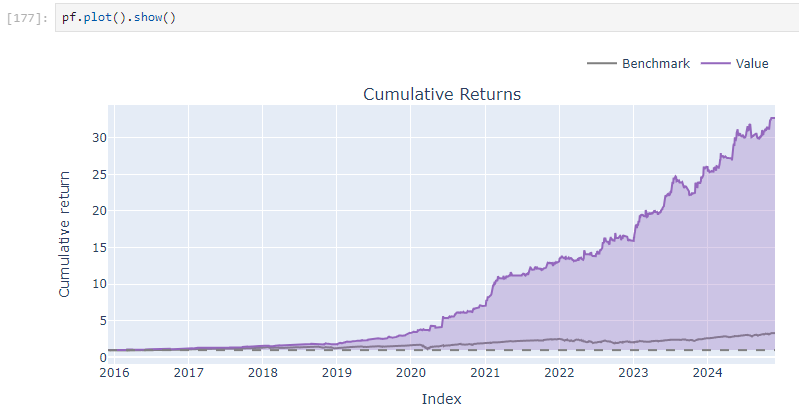
VectorBT provides a solid tool for backtesting quantitative trading strategies. This is what ML based quant trading model's backtest might look like out-of-sample. Benchmark is SPY buy and hold.
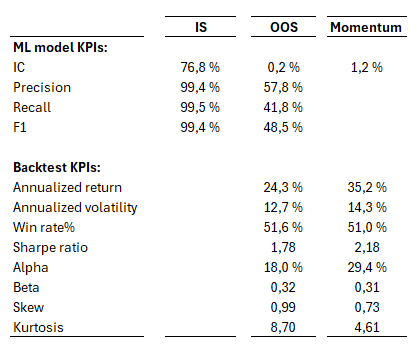
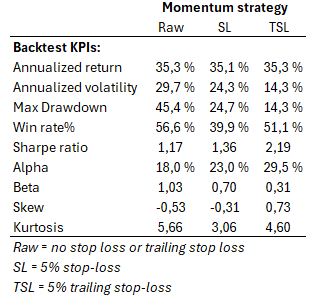
It is quite easy to find ML model that fits the data perfectly in-sample, but then totally breaks down in the out-of-sample. Momentum with trailing stop loss used as a benchmark. Without trailing stop loss, model would have also got beaten by SPY buy and hold.