Did Trend Precognition just say, “Go Away” to May?
The outlook for June is clearly bearish, but remember, this new Trend Precognition signal technically doesn't validate until this candle closes. As long as bitcoin:native price stays below $82.8k, I expect it to validate.
We still need to watch levels to determine if this is going to develop into a base building consolidation, or the next leg down.
The fact that price just fell through another Timescape level is another sign of weakness. The real test comes at the Q2 2026 Timescapes in the $68k - $69k range.
Losing that level has macro implications that would send Bitcoin to a structural test around the local bottom, the trend line, and the 200-DMA which are clustered in the $59.9k - $65k range.
If bulls lose that range - pack your bags for Bearadise.
Are you prepared for this?
We have a synchronized D, W, M close on Sunday. Expect volatility to build through the Close, but there's some nuance to it...
There’s a lot of daylight between here and a green Monthly close at $76,310. Watch to see if yesterday's bounce off the 100-DMA is durable.
If bulls are going to make a stand at a macro level, it would make sense to build a base above the 100 DMA. That supports the idea of a liquidation hunt to the $76k range to challenge for a green M close - that’s going to be a tough challenge considering order flow is running down the drain, a Death Cross is forming between the 21/50 DMAs (likely Sunday or Monday), and we have a potential Head & Shoulders pattern in play that could lead to a support test at the Q2 2026 Timescape Levels in the $68k - $69k range.
Pro Tip: Keep eyes on the Weekly RSI to see how it's trending after the W close.
$LAB tokens that were previously sent to the Gate deposit address from multiple sources are now being moved to the hot wallet.
The amount is around ~3M tokens. Compared to the tokens distributed by Bitget, it’s not extremely large, but it could still bring volume.
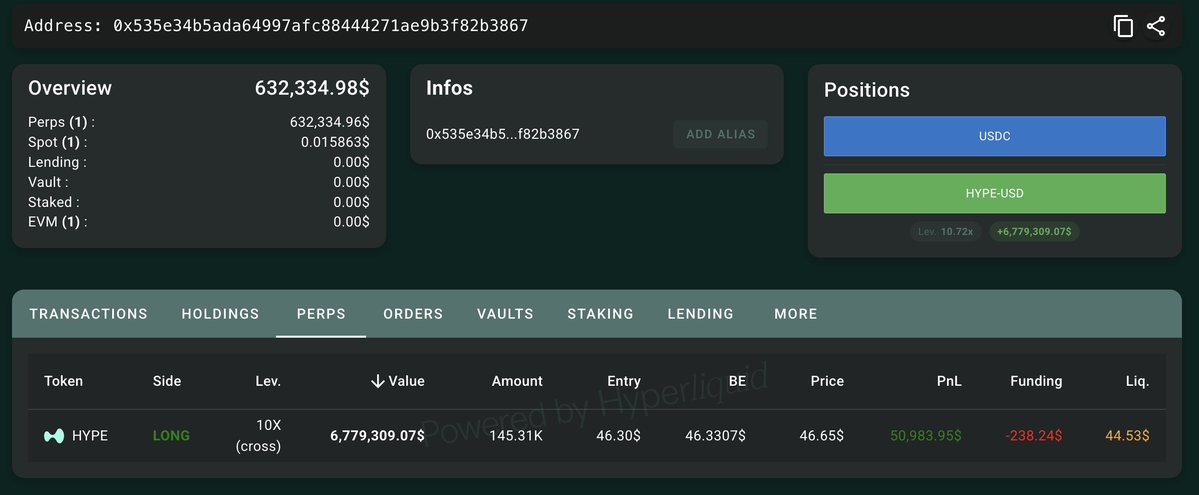
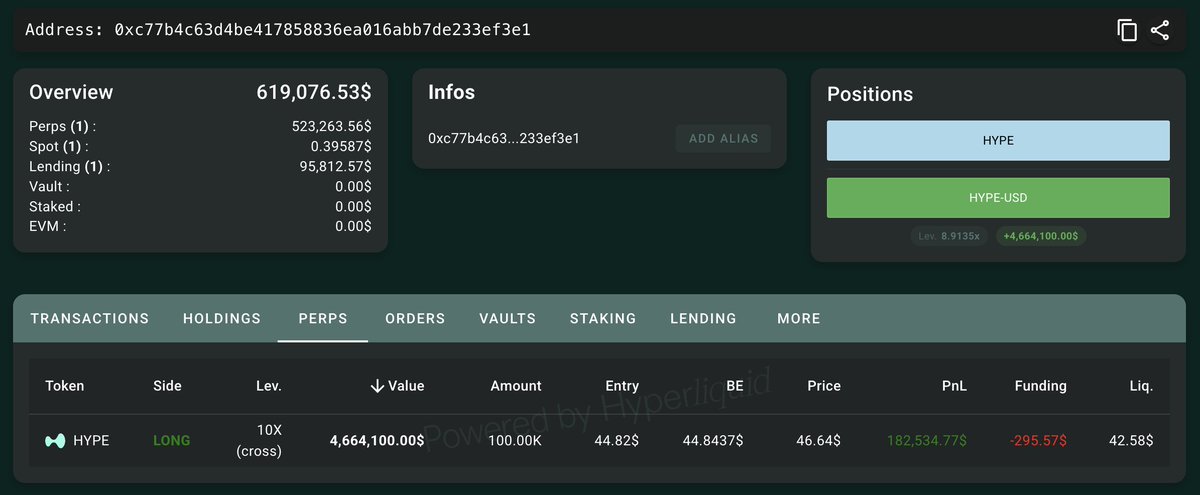
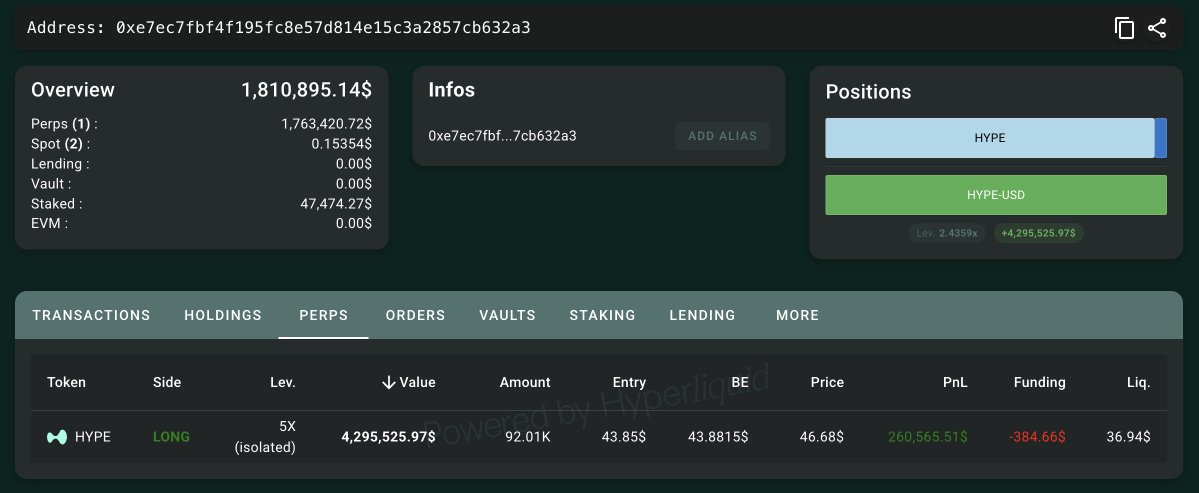
Whales are piling into $HYPE longs!
0x535e opened a 10x long on 145,310 $HYPE($6.78M).
Liquidation price: $44.53
0xc77b opened a 10x long on 100,000 $HYPE($4.66M).
Liquidation price: $42.58
0xe7ec opened a 5x long on 92,015 $HYPE($4.3M).
Liquidation price: $36.94
https://t.co/EYPjlbZ4mW
https://t.co/4df5VvTHbu
https://t.co/ykLrgfONYa
With the Monthly Close looming tonight, I've zoomed into the Bitcoin Daily chart to show you some important developments that could challenge the Bearish trend:
✅Support test and D close above the Macro Trend line
✅Support test and D close above the 21-Day MA
✅Daily RSI reverted back up to the trend line
We also have a pending Golden Cross developing between the 50-Day and 100-Day SMAs.
Despite the bullishness of the successful support tests the D close, and the imminent Golden Cross, the early morning PA is not decisive yet...
That gives the market time to lure in more risk.
At the moment $BTC is trading around $76k, right above the 21-Day MA, and right at the RSI trend line.
That has BTC price hovering between a cluster of leveraged longs to hunt in the $73.9k - $75.4k range and a cluster of shorts to squeeze in the $76.3k - $78.9k range...
But with TradFi about to open and the Monthly close coming tonight, we should expect volatility to increase through the day.
Speculating on whether the bullishness of the D close was truly a sign of foundational strength, or simply the launchpad for another bull trap is risky, and so is being married to the 4-year cycle and 2022 Bear Market Breakdown narratives, because they can provide a false sense of certainty that can lead you into getting rekt.
THIS is where patience, discipline, and planning are your greatest tools.
The pending Monthly and Weekly closes carry more weight than the D close, and A LOT can happen between now and then.
Know your invalidations...
Losing support at the trend line at $74.4k opens the door to $69k, and an eventual bear flag breakdown.
A push above the bear flag at $79.8k could put the Cup & Handle pattern in play and create a pathway to $87.5k...
Or, it could be one of the nastiest bull traps of all time.
History would suggest that a bull trap is the most likely scenario.
I'll be watching Trend Precognition for new signals on the pending M and W candle closes, and I'll also be focused on order book liquidity and order flow data to gain some insight on how things are likely to develop.
Remember, wicks don't mean sh!t.
Patience pays...
Invalidations come on candle closes.
Today is JPow's last FOMC rate decision day press conference as @federalreserve Chairman. There won't be a rate cut, but he's going to drop some facts about the economy that will likely move markets.
Thursday is the Monthly candle close.
Sunday is the Weekly candle close.
If that recipe for volatility isn't spicy enough for you, sprinkle in some TACO seasoning.
Meanwhile...
There's a huge cluster of longs down to $75k that are at risk of getting hunted.
If bitcoin:native price gets that low it will satisfy a support test to the 21-Day SMA. I would actually like to see it push a little lower to test support at the trend line ~$74.6k.
If it holds, I'd expect a rally back to the top of the range for another breakout attempt.
If it fails, I'm looking for another support test at the Q2 2026 Timescape Levels in the $68k - $69k range which have confluence with the bottom of the bear flag.
The Bitcoin bottom is not in.
3 charts in 10 minutes: 👇
Halving cycle, on-chain data average buy price, and the MACD crossover everyone is reading wrong.
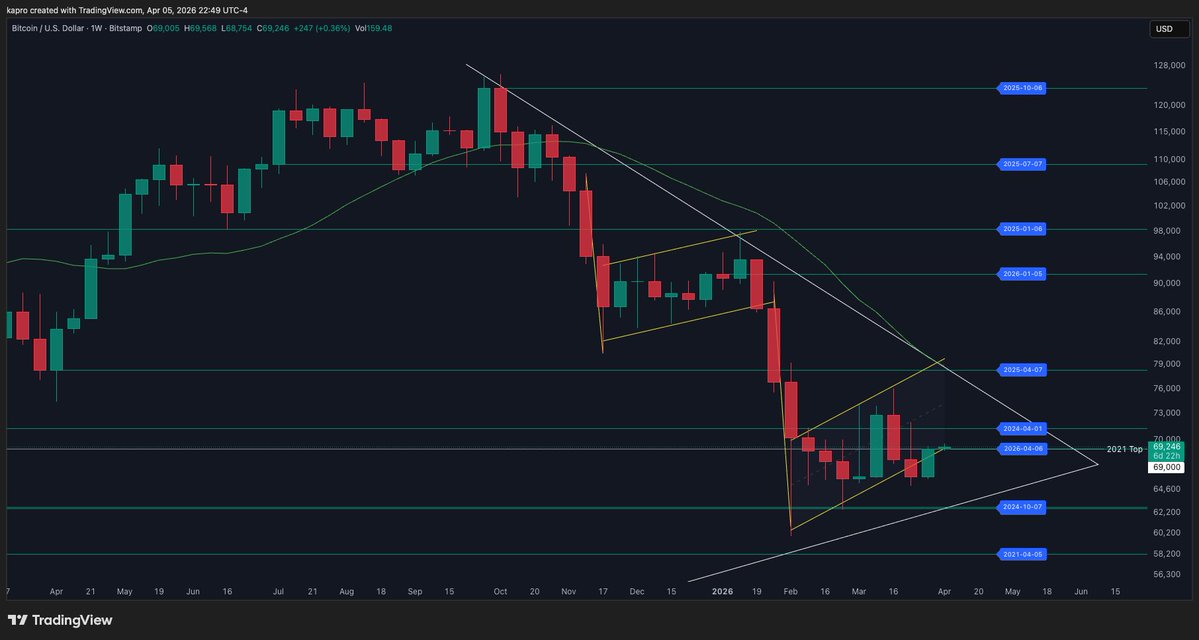
A KEY STRUCTURAL LEVEL JUST GOT STRONGER
$BTC's history around a precise point in the macro structure just got stronger.
Whether price is above it or below at any given moment is a matter of MACRO implications.
The line has been drawn at $69,000 because:
☑️ 2021 Top
☑️ Mar 2024: Formed a MACRO Cup & Handle pattern
☑️ Mar - Nov 2024: Served as the R/S Flip line on 8 months of consolidation
☑️ Nov 2024: Breakout on Election Day Trump Pump
☑️ Feb - Apr 2026: Again served as the R/S Flip line on consolidation
☑️Apr 6, 2026: Timescape Levels prints the Q2 Weekly Open at $69,005
That's a lot of MACRO confluence at one precise level.
To add context, the 21-Day and 50-Day SMAs have just fallen below and are on a trajectory for a death cross this week.
That doesn't bode well for bulls so don't believe the hype.
To be clear, a rally to the top of the MACRO structure at $78k is certainly in the realm of possibilities at some point, but that's not a consideration until we start seeing weekly closes above $69k.
I'm not talking about the psychological level of $70k, or the Timescape Level at $71.3k, which also has some structural significance.
I'm speaking specifically of $69k.
If Bitcoin Bulls can manage to close the week above the new 2026-04-06 Timescape level at $69k, then we can talk about what it's going to take to rally towards a potential breakout attempt.
Not so coincidentally, last year's pair of Q2 Timescape Levels also happen to have some structural importance.
The first at $71.3k, and the second ~$78.5k. The latter, has confluence with the 21-Week SMA, the top of the Bear Flag, and the top of the MACRO structure.
It's going to be extremely hard to break that level, especially if the war continues. If we're lucky enough to get there, I'd be looking for rejection and likely the last great opportunity for a MACRO short.
Here's the wild card:
EL TACO controls whether this rally extends or reverts back to the downside.
If we see an extension of the rally without an end to the war and/or the flow of shipping traffic through Hormuz, then I'd consider it the TACO pattern.
Ultimately, we are still in a bear market until we break out of the MACRO structure. Until that happens, I'm buying dips and selling rips. #NFA
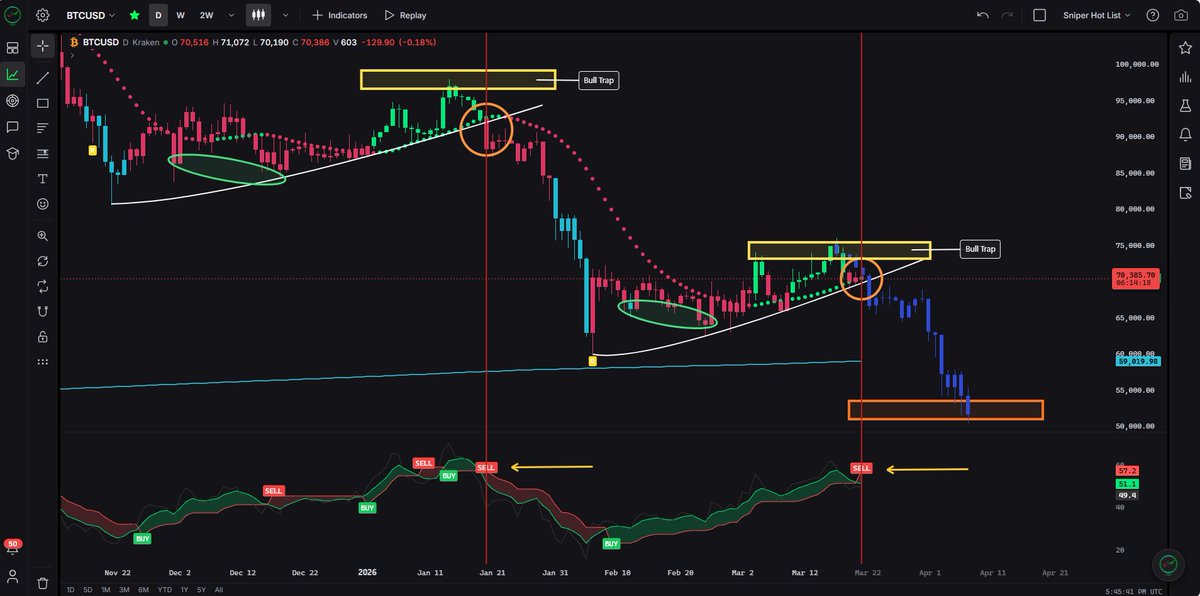
The last time this RSI setup fired a SELL signal was January 20th.
#Bitcoin dropped from $87K to $60K within 16 days.
Now it has a pending sell signal again, same sniper indicator, same structure, different price level.
Yellow target boxes set the bull trap.
There's a lot of speculation about when Bitcoin's next big move is coming. The recent Death Cross on the Weekly chart leans towards another leg down coming soon, but it's worth noting that Moving Averages are lagging indicators, so the response doesn't have to be immediate.
We've only seen this particular Death Cross between the 21-Week and 100-Week SMAs four times in Bitcoin's lifetime.
In 2015 and 2022 $BTC rallied through the Death Cross before another leg down.
In 2018 the Death Cross marked macro support...
And now, in 2026, we're waiting to see how price develops from here.
Sure there are a lot of similarities to the current PA and 2022, but that's not a guarantee that price will continue to develop the same as it did back then. After all, fractals are good...until they're not.
And the historical data is limited, and inconclusive.
The only thing that we can say with certainty, is that Bitcoin spent 8 months consolidating in this range back in 2024 which is what built the structural R/S Flip level bulls and bears are fighting over now.
Structurally, there is time and room for BTC to stay in this range until mid-June. Chances are high that price breaks down or out sooner than that, but the point is, you should be prepared to spend more time in this range than most of the market expects.
$BTC is trying to validate an R/S Flip at the 21-Day SMA, and is now sizing up the $69k-$70k range.
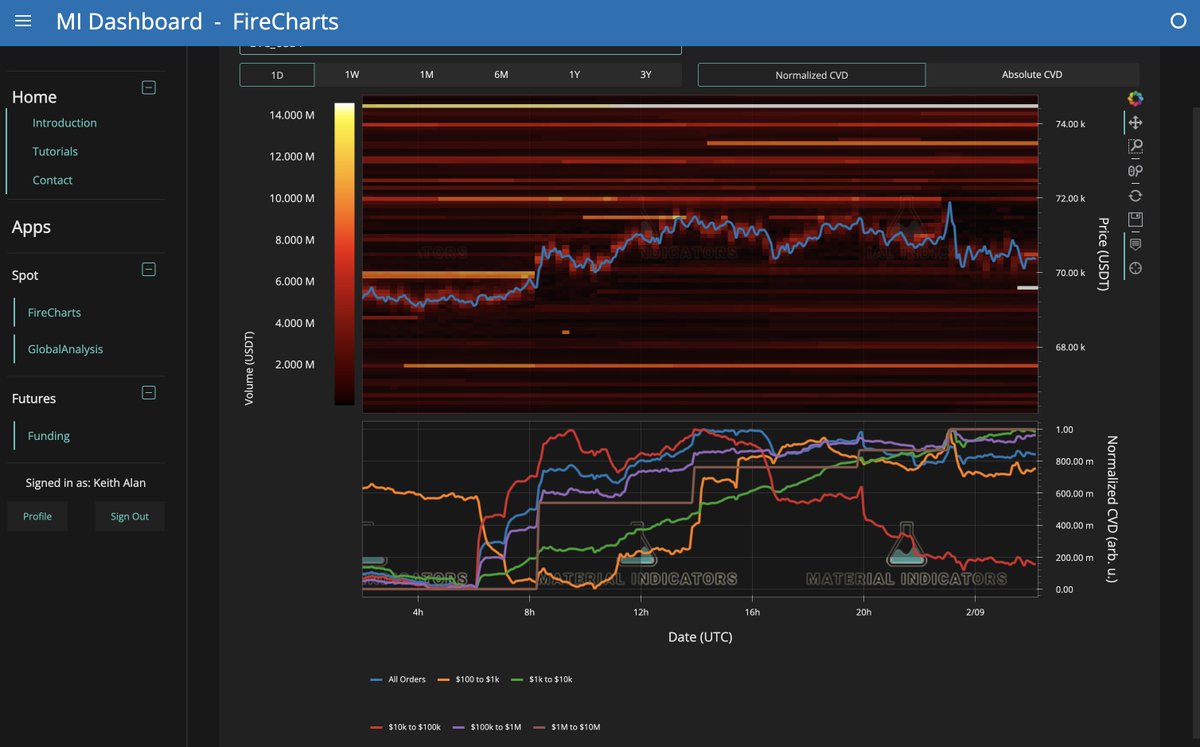
Meanwhile, FireCharts shows ask liquidity is moving in both directions, and brown Mega Whales are leading a feeding frenzy.
A Daily candle close above the 21-Day SMA keeps this rally alive.
Finding more similarities with 2022 in the $BTC chart as Weekly RSI moves towards what has historically been, once per cycle lows in oversold territory.
In 2015 and 2018 it marked bottom, however in 2022 it led to a 5 month consolidation before establishing a macro bottom.
This doesn't mean it has to develop the same way this time, but it's worth watching closely to identify similarities and deviations in the pattern to help with forecasting.
$BTC continues to show signs of weakness around $69k, however if you look back to 2024 you will notice that price spent an extraordinary amount of time consolidating in this range.
That 8 months of consolidation, coupled with the 2021 Top created structural strength at this level, and it's good to see the market acknowledging that.
Why?
Because it gives us something that's relatively predictable in an otherwise, chaotic market.
While history doesn't have to repeat itself, we know that it often does, and if it does, we can expect consolidation in this range to continue for a while.
If a bullish catalyst emerges and triggers a recovery, we can conclude that the additional consolidation in this range, fortified structural support.
Likewise, if the downtrend extends from here as history (and the charts) suggests, resistance at this range will be even stronger than it was in 2024. That doesn't mean it will be impenetrable, it just means that it's going to take a lot of momentum to break it. At this moment in time, we aren't seeing enough momentum to do that in a sustainable way.
Watching order flow and liquidity dynamics in FireCharts to see when that changes.
Last night while watching the Super Bowl, I took a peek at FireCharts and noticed some suspiciously spoofy looking bids show up in the $BTC order book, appearing to establish a buy wall above $69k and trap some longs. I immediately shared it with the PREMIUM+ Community on @Telegram, and 90 minutes later it was rug pulled - as expected.
Then this morning, I woke up to another rug pull at $67.5k.
I’ve not even had my first cup of coffee yet, but these shenanigans inspired me to coin a new term:
Double Rugged Support - A f#ckery that occurs when 2 levels of support get rug pulled sequentially.
Used in a sentence: Those mf’ers double rugged support! 🤣
It’s going to be an exiting week in the Cryptoverse.
Stay tuned for today's BitBreak Live analysis.
Subscribe here so you never miss an analysis.
https://t.co/SLxPqm3Twh
After the Genius Act was signed last summer, I said the Clarity Act would eventually open the door for banks and legacy institutions to enter the Cryptoverse in a robust manner. We knew that they wouldn’t be buyers while $BTC and $ETH were making new highs. Historically, legacy institutional capital looks to accumulate on weakness. While I have no direct evidence banks are driving price lower, as you can see in FireCharts, suppression is visible in the order book.
Between late October and early November, I flagged several bear‑market confirmations:
⚠️ The 21‑Day MA Death Crossed the 200‑Day
⚠️ $BTC lost support at the 50‑Week MA
⚠️ Weekly RSI closed below 41
Those signals were validated and re-confirmed at the November close, and I've continued to share each additional validator as they've presented themselves. I hope that helped you position yourself for the bear market we've been experiencing.
That said, no analyst is right 100% of the time. While price has moved to the downside targets I outlined, I misjudged where relief rallies would occur this week. I expected a bounce well before $69K and more resistance at that level based on the amount of time we consolidated there before the Election Day Trump Pump began. Today, price sliced through that level with almost no friction at all, at a pace I never expected. For that, I want to be clear and accountable: I got that part wrong.
The good news is that price can’t fall indefinitely without relief, even if the macro bottom isn’t in yet. While many are focused on the 200‑Week MA, experience reminds us that no level is guaranteed to hold, and my broader macro targets remain lower.
My hope is that you’ve been able to navigate this bear market without getting rekt. If my analysis helped you protect capital or avoid bad trades, I’d genuinely appreciate hearing from you.
No matter what comes next, I’ll continue doing my best to help you understand the data and navigate the market intelligently. Needles to say, at this stage, capital preservation is key so you have dry powder to take advantage of the opportunities ahead.