Indian students are DIYing a semiconductor fab at IIT Bombay.
In just 10 months they've built:
1. A DLP-based lithography machine.
2. A tube furnace to oxidise silicon.
3. A DC plasma sputter.
Total cost: ₹30 lakh.
Here's a rare behind-the-scenes look at HackerFab IITB.
@ayushgg92@sunilgurjar01 And in momentum investing with a "tight stoploss" doomed to failure. Then most of momentum fund should fail as nobody follows a " tight stoploss". But good to know this info.
Semiconductors are not a single industry.
They are an entire ecosystem. ⚡
🇮🇳 India's semiconductor market is estimated at ~$52 Billion today and is expected to cross ~$100–110 Billion by 2030.
The opportunity extends far beyond chip fabrication.
Key listed players across the value chain:
• 𝗕𝗘𝗟 → Defence Electronics & Radar Systems
• 𝗗𝗶𝘅𝗼𝗻 𝗧𝗲𝗰𝗵𝗻𝗼𝗹𝗼𝗴𝗶𝗲𝘀 → EMS / Electronics Manufacturing
• 𝗖𝗚 𝗣𝗼𝘄𝗲𝗿 → OSAT / Semiconductor Packaging
• 𝗔𝗺𝗯𝗲𝗿 𝗘𝗻𝘁𝗲𝗿𝗽𝗿𝗶𝘀𝗲𝘀 → Electronics Manufacturing
• 𝗧𝗲𝗷𝗮𝘀 𝗡𝗲𝘁𝘄𝗼𝗿𝗸𝘀 → Chip Design & Telecom Hardware
• 𝗞𝗮𝘆𝗻𝗲𝘀 𝗧𝗲𝗰𝗵𝗻𝗼𝗹𝗼𝗴𝘆 → Embedded Systems + Electronics Manufacturing
• 𝗦𝘆𝗿𝗺𝗮 𝗦𝗚𝗦 → Industrial & Automotive Electronics
• 𝗔𝘃𝗮𝗹𝗼𝗻 𝗧𝗲𝗰𝗵𝗻𝗼𝗹𝗼𝗴𝗶𝗲𝘀 → Export-Focused EMS
• 𝗠𝗼𝘀𝗖𝗵𝗶𝗽 𝗧𝗲𝗰𝗵𝗻𝗼𝗹𝗼𝗴𝗶𝗲𝘀 → Semiconductor Design IP
• 𝗦𝗣𝗘𝗟 𝗦𝗲𝗺𝗶𝗰𝗼𝗻𝗱𝘂𝗰𝘁𝗼𝗿 → Chip Packaging & Testing
A semiconductor cycle does not create value in one company.
It creates value across design, manufacturing, packaging, testing, electronics assembly and end applications.
The biggest mistake is studying semiconductor stocks. The better approach is studying the semiconductor value chain.
Capital flows to ecosystems before it flows to individual winners. 📌
Which company from this ecosystem do you believe has the strongest long-term positioning ❓
Save this for future reference 🔖
Educational purpose only. Not investment advice. I may have positions in mentioned securities.
Downloading Historical data has become lot more easier. Vibe coded and created a portal with the help of @claudeai and @Lovable ai using @DhanHQ API.
Now You can download historical Options data,Nifty futures data and Stocks Intraday & EOD data.
👉👉 https://t.co/Zp0UmnEshK
Selling volatility is the most profitable trade in markets until it is the most expensive.
Think of the stock market like a giant insurance market. When traders get nervous, they buy options the way homeowners buy fire insurance, they want a payout if something bad happens. The "price" of that insurance is called implied volatility, the famous VIX.
Three professors: Bollerslev, Tauchen, and Zhou studied 15 years of S&P 500 data and found something strange. The insurance was almost always overpriced.
Implied volatility beat realized volatility 85% of the time. The gap, which they named the Variance Risk Premium, predicts more than 15% of where the market goes the next quarter.
Sell the fear, pocket the difference, repeat. 2017 was the year selling fear felt like free money.
The VIX in November, the lowest reading in its history. The S&P 500 closed green every single month, the first time that had ever happened in a calendar year. The XIV note, a Credit Suisse product designed to pay you every time fear went down, had returned 1,211% in eight years. LJM fund, run by Anthony Caine out of Chicago since 1998, sold naked puts on S&P futures with leverage made millions. By late January 2018, $805 million sat in the fund.
Then February 5, 2018.
The VIX opened at 17.31 normal. By the close it had hit 37.32. That is a 115.6% jump in a single day, the largest in the index's history. Fear didn't just return, it arrived in a stampede.
XIV was built to do the opposite of the VIX. When fear doubled, XIV collapsed. The note went from $144 to $7. The prospectus had a clause that let Credit Suisse shut the product down if it lost more than 80% in a day. They pulled the plug the next morning. Eight years of compounding, gone.
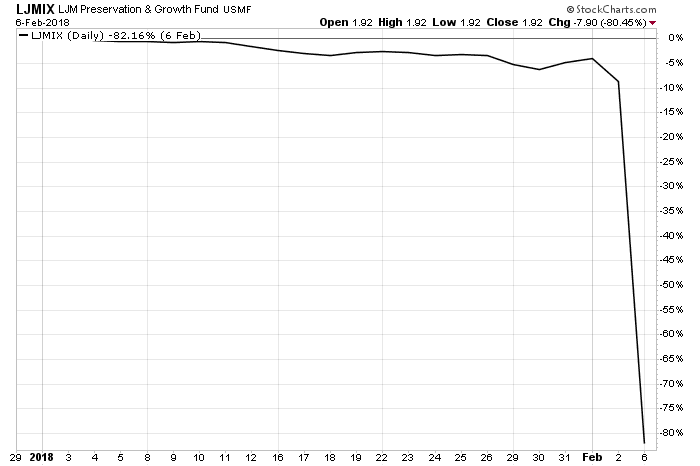
LJM was running the same trade with borrowed money. The fund's per-share price collapsed from $9.67 to $1.94 an 80% loss in 48 hours. By March its AUM had fallen from $805 million to $9.8 million.
The math behind the trade is real. Bollerslev was not wrong. But the premium is not free money it is rent paid by a tenant who, one day, is going to burn the building down. Eleven months out of twelve, the rent arrives on time and you feel rich. The twelfth month, the fire starts, every payment you ever collected gets handed back in a single claim, and if you bought the building with borrowed money, you lose the building too.
This is why selling volatility looks like genius for years and then ends a career in one day.
The market remembers every easy month it gave you. One day, without warning, it sends the bill for all of them at once. The traders who survive decades selling fear share one habit; they treat risk management as the product and returns as a side effect. They never sell so much insurance that a single fire can end them.
This beautiful lazy Saturday morning, sipping on the best coffee in the world ( available on Amazon US + some stores), smooth Caffè di Artisan Luxe Coffee, idly ran some 12 year NIFTY numbers & compared it to a Bank FD, both adjusted for taxes and risk. No conclusions. Just data.
Awaam kya kehti hai?
12-Year Performance Comparison (May 15, 2014 – May 15, 2026):
A. Nifty 50 TR Index (INR)
Post-Tax CAGR: 9.38%
Annualized Volatility: 15%
Tax & Risk-Adjusted Return: 0.617
B. Nifty 50 Index (USD)
Post-Tax CAGR: 5.11%
Annualized Volatility: 15%
Tax & Risk-Adjusted Return: 0.336
C. Bank Fixed Deposit (INR)
Post-Tax CAGR: 4.93%
Annualized Volatility: 0.25%
Tax & Risk-Adjusted Return: 19.720 ( + Return OF CAPITAL is guaranteed)
(Note: Nifty TR returns are adjusted for ~16% LTCG tax. Bank FD returns are adjusted for the 31.2% maximum marginal tax bracket. Ratios reflect post-tax CAGR divided by annualized risk -volatility.)
@RahulGandhi Having no issue with @RahulGandhi ji neither a hard cord right wing.But the thing which hurt the most is why leaders in congress rule states fight each other for the top post. Rest best wishes. Just want to see my country grow.
The energy transition will not be won by solar panels. It will be won — or lost — by the electricity grid. The US grid was designed in the 1960s. Europe's is fragmented and aging. India's is chronically undersupplied. Trillions in clean energy capex is being pumped into infrastructure that can't carry the load. Grid investment is the most underpriced trade of the decade.
There are increasing cases of power producers being marooned due to no grid availability.
Make a note : Grid investment is the most underpriced trade of the decade.