In my opinion, now that we’ve seen the stock market and crypto separate I don’t see crypto making any type of big move up until the stock market has a major pullback or tops. That’s where all the money looks to be going currently.
However, I am anticipating quite the rotation back to crypto at that point. The money ALWAYS goes where the liquidity is and right now that’s the stock market.
Quick reminder: the #LTCBTC chart has been in a falling wedge since last November and price is now at the upper rail. There is also bullish RSI divergence since April.
Not many are looking at this because most are just saying Litecoin is dead. When I hear that type of chatter, then I know it's a good investment!
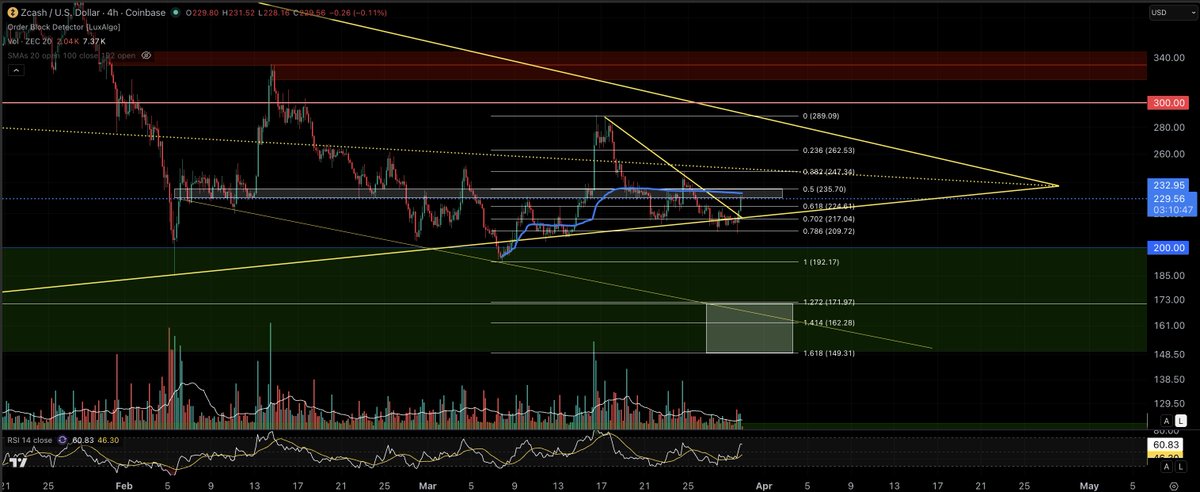
This is most likely another liquidity grab for #ZEC right into HTF resistance and the VWAP. Pretty standard stuff for this asset. Not enough volume to push through this area of resistance. My guess is this is the move up before the flush down if more volume doesn't come in.
@MMCrypto Take note, If you bet on 2x positions +, don't use Cross, always Isolated ! You can get stupidly liquidated on bouth or all positions, many new investors don't know this ☝️🙋♂️
My base case on #ZEC is a larger fakeout before the real move.
The structure is compressing inside a macro triangle, and markets often sweep liquidity both directions before choosing a path. The current move is a bit early to be leaving a falling wedge.
Two scenarios from here:
Bullish:
- Price accepts above ~238–240
- Builds structure above resistance
- Opens the door toward 250–270+
Bearish:
- This push becomes a bull trap
- Price falls back inside the wedge
- Liquidity sweep below the triangle toward the 170 area
Compression like this usually resolves with a violent move. I'll be watching acceptance vs rejection at resistance.
#ZEC is right at the upper rail of this falling wedge after wicking above it (liquidity grab). This further legitimizes this structure. Price has had difficulty getting through this HTF resistance box.
If price broke out above the wedge now, that would be early relative to the apex. In a previous post I did draw the scenario of this touch before dropping lower. Let's see how it plays out.
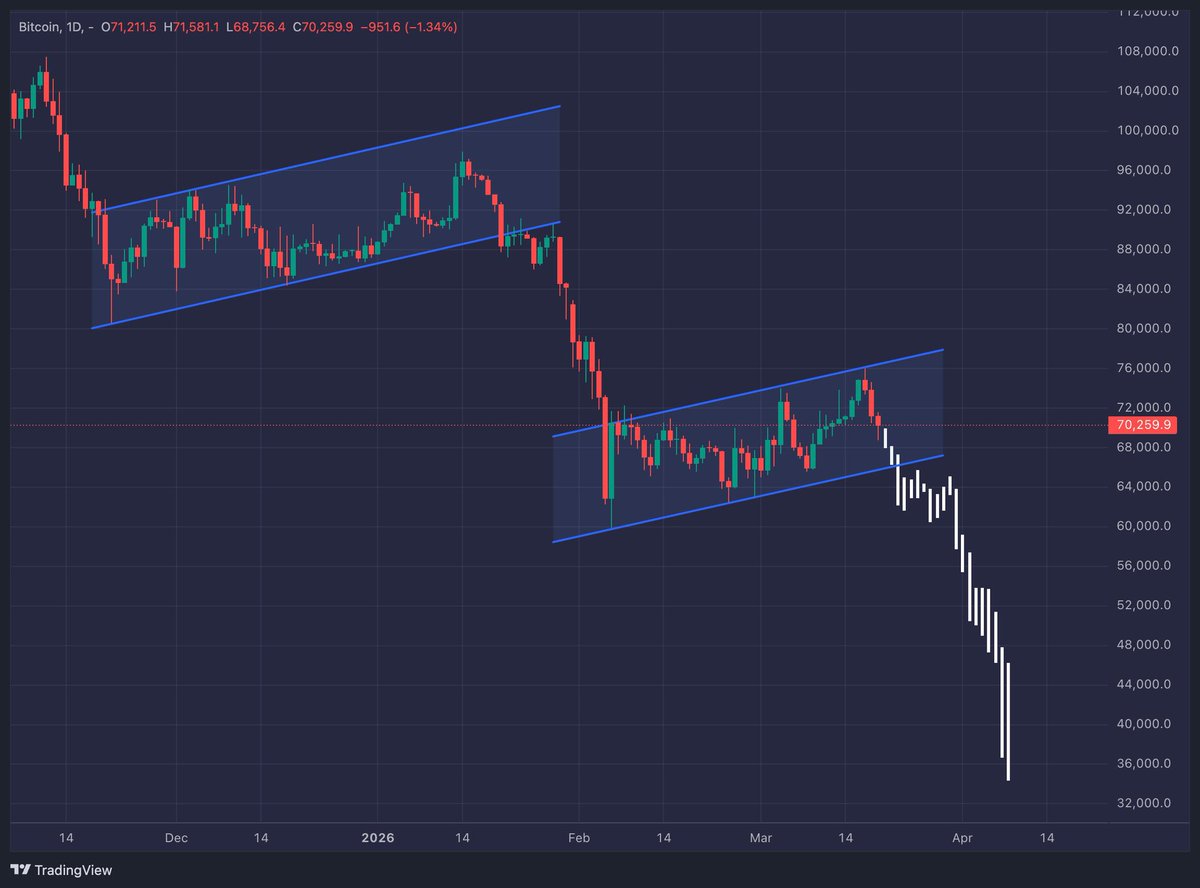
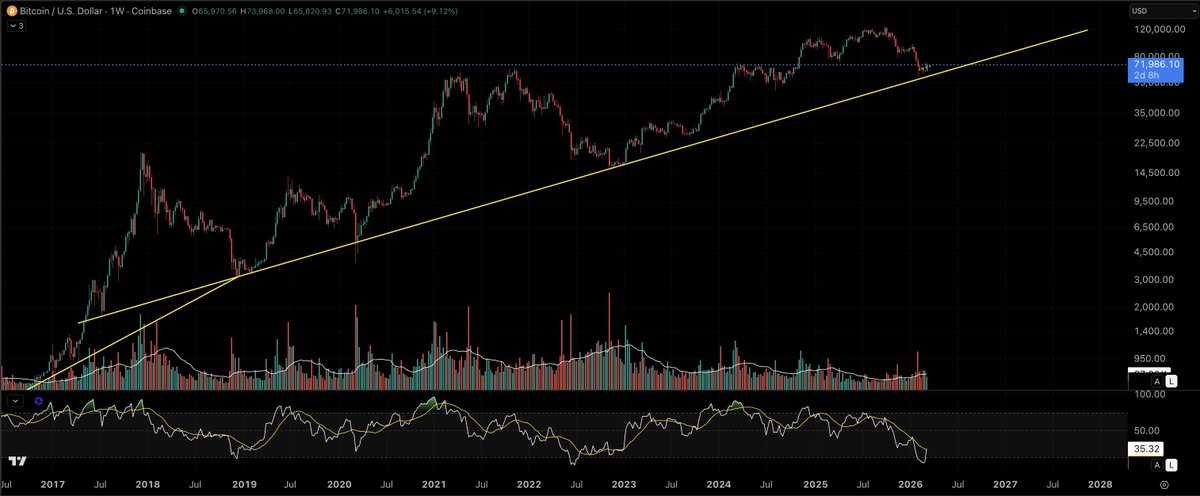
What I see with #BTC as a possibility. If current price has topped, the micro fib chart aligns the 1.618 fib extension with the 9 year macro trend rail. That rail has been breached only one time and that was Covid. This would create a double bottom scenario.