Jensen Huang told a room of global investors that AI is not one industry. It is five stacked on top of each other. Most people are investing in layer four and ignoring layers one through three entirely.
He called it the five-layer cake.
Layer one is energy. Jensen said this is the single greatest opportunity for the energy industry in a hundred years.
The first time in a century that the grid in most countries can actually attract serious capital. Nuclear, solar, wind, hydrogen, it does not matter what form. If it produces energy, it gets funded. Siemens, GE Vernova, Mitsubishi. That is why they are all doing so well right now.
Layer two is chips, computers, networking, and silicon photonics. Everything that processes the intelligence.
Layer three is infrastructure. Land, power, buildings, data center operations. Every single one in short supply today.
Layer four is the model layer. OpenAI, Anthropic. The layer everyone talks about.
Layer five is applications. Every startup applying AI to financial services, legal, healthcare, logistics, transportation. Last year alone, a hundred billion dollars of venture capital went into this layer. The single largest VC year in the history of humanity.
Then he said the number that stopped me cold.
We are putting one trillion dollars into this five-layer cake this year. That sounds enormous. Jensen thinks the AI industry will eventually run at twenty trillion dollars per year.
We are one trillion in of a twenty trillion dollar per year ecosystem.
Most people watching AI are staring at layer four. Jensen was describing layers one through five as a single compounding system where every layer feeds the one above it.
The people who understand that will invest differently than the people who do not.
I've realized the majority of my profits have never come from buying the breakout itself.
It's come from buying the pullback after the breakout.
Almost every trade I take starts with a stock coming out of a large base. I'm talking about names that have spent months, and sometimes years, moving sideways while institutions accumulate.
Then eventually something changes... maybe it's earnings, or it's a new product cycle. Maybe it's a theme gaining momentum? Whatever the catalyst is, price finally starts leaving the range.
And funny enough, that's where the 99% get excited.
Ironically, that's where I usually become patient.
The breakout gets my attention, but the pullback is often where I get involved.
1 of my favorite setups is the first pullback after a major base breakout. If I miss that one, I'll usually focus on the second consolidation. In my experience, these are often the "highest quality" opportunities because the stock has already proven it can break out, institutions have already shown their hand, and now I'm simply waiting for the market to give me a lower-risk entry.
I like to think about it this way:
- A breakout is the market making a statement.
- The pullback is the market asking a question.
"Are buyers actually willing to defend this area?"
That's what I'm trying to figure out.
When a stock pulls back after breaking out of a large range, I'm paying very close attention to how it behaves. Does it immediately fall apart? Or does it hold key levels and refuse to give back much ground?
When it comes to behavior, I look for TIGHTNESS.
If a stock breaks out 20%, then spends the next two weeks trading in a very tight range while volume dries up, that's constructive behavior to me. Sellers are becoming exhausted while buyers continue absorbing supply. The tighter the action becomes, the more interested I become!
Volume is another huge clue.
During the breakout, I want to see volume expand. That's evidence that institutions are participating. Then during the pullback or consolidation, I want volume to contract. If volume is exploding on every red day, that's usually not what I want to see. But if volume starts drying up while price remains near highs, that's often a sign that selling pressure is becoming limited.
1) Price tells me what happened.
2) Volume tells me how much conviction was behind it.
I also spend a lot of time studying the personality of a chart.
Some stocks are constructive, and some stocks are sloppy.
Some names respect the 9EMA for weeks + months. Others constantly undercut and reclaim support before moving higher. Some stocks have violent shakeouts. Others grind methodically higher.
This is why I constantly study prior winners.
I'm trying to understand how a stock behaves when it's healthy.
> Does it respect moving averages?
> Does it recover quickly after pullbacks?
> Does it close near highs?
> Does it show relative strength on market weakness?
> Does it stay tight?
Those are the little nuances that I look for from a potential leader.
A simple list I look for:
1) Find a stock breaking out of a large base.
2) Confirm relative strength v.s. the market + sector.
3) Wait for the first or second pullback.
4) Watch volume dry up.
5) Look for tightness near major support.
6) Execute on 15 or 30min pivot reclaim.
7) Risk against the low.
Most people think the money is made by finding the perfect breakout... but I've found the money is usually made by finding the strongest stocks and then having the patience to wait for the first real opportunity to join the trend.
If the stock is truly a leader, the breakout is often just the beginning.
The first pullback is where the real asymmetric opportunity tends to show up. That's where I want to be positioned. That's where risk is usually the smallest.
And if the trend continues, that's often where the biggest winners begin!
Chart: $AMKR.
This is one of Tucker's most explosive interviews about Trump, Iran, and who is actually in control of the U.S
He said Trump was pressured into a war he didn't want, knew it was a bad idea, understood it could wreck his presidency and blow up the global economy... and did it anyway.
Not because he was fooled or misinformed, but because he couldn't stop it.
Think about what that means.
Trump spent years campaigning against forever wars. If he understood the risks of attacking Iran, hated the idea of another Middle East disaster, and yet ended up there anyway, then the story isn't about Trump.
It's about the forces that were able to move him so far away from his campaign promises and values.
And Tucker goes there.
He talks about the donors, Netanyahu, the pressure Trump was put under, and how he changed after the Butler shooting.
He also talks about why he believes he'll eventually be silenced.
And then, right in the middle of the interview, Trump posts that peace may finally be on the table.
So the whole conversation suddenly becomes something bigger: Can Trump still break free? Can he actually walk away?
Or was the moment everyone voted for in 2024 already lost long ago?
Whether you agree with Tucker or not, this isn't some recycled Fox News talking-point session.
This is asking a question that almost nobody in mainstream politics is willing to ask:
If the most powerful man in the world can't do what he wants, then who the hell is actually in charge?
@TuckerCarlson, @TCNetwork
My conversation with Alex Sacerdote, founder of Whale Rock Capital Management.
Alex runs more than $17B and has been one of the best performing tech investors for years, though he keeps a low public profile.
As you'll hear, he is singular in how he thinks about investing through technology cycles.
For over 25 years, he has built his entire investment framework around a single idea, the S-curve.
We discuss:
- The AI L-Curve
- When to buy into an S-curve and when to sell out
- The de-commoditization of data center hardware
- Why he went net short software
- His two models for tech adoption
- Finding alpha
Enjoy!
Timestamps
0:00 Intro
9:55 AI's L-Curve
19:31 Whale Rock's S-Curve Playbook
26:14 Spotting Inflection Points
32:02 Finding AI Winners
40:04 AI vs Software
48:13 The Hardware Renaissance
58:04 Why Investors Miss AI
1:05:18 Whale Rock's Research Machine
The Kettlebell Swing Everyone Gets WRONG!
Mastering the kettlebell swing is crucial for effective strength training and overall fitness. This video breaks down the correct technique for a powerful kettlebell swing, focusing on hip drive and proper form to maximize your workout!
IVERMECTIN: FULL DOSAGE SCHEDULE FOR CANCER & PREVENTION
1000s of people use Dr. William Makis MD’s IVERMECTIN dosing chart. Here’s a clear, categorized breakdown based on body weight (mg/kg per day).
LOW DOSE: ≤ 0.5 mg/kg/day
**Best for:**
- Cancers in remission
- Strong family history or genetic predisposition
- Prophylaxis (preventive)
**Side effects:** No long-term side effects reported.
**Example:** Dr. Tess Lawrie reported a Stage 3 ovarian cancer case treated with chemo + 12 mg ivermectin daily. Tumor marker CA125 dropped from 288 to 22 after 2 months and the tumor vanished.
MEDIUM DOSE: 1.0 mg/kg/day
**Best for:** Starting dose for **most cancers** (lung, pancreatic, renal cell, gastric, etc.).
**Side effects:** No long-term side effects reported.
**Example:** Dr. Shankara Chetty’s 70-year-old prostate cancer patient (PSA 89) took 45 mg/day (plus lactoferrin). After two months PSA fell to 10.9.
HIGH DOSE: 2.0 mg/kg/day
**Best for:** Very aggressive cancers (leukemia, pancreatic, brain cancers).
**Side effects:** No long-term side effects reported.
**Example:** Dr. Allan Landrito’s Stage 4 gallbladder cancer patient took 2 mg/kg daily for 14 months — cancer disappeared.
VERY HIGH DOSE: ≥ 2.5 mg/kg/day
**Best for:** Extensive metastatic disease, extremely poor prognosis, or certain brain cancers.
**Side effects:** Possible short-term & transient visual effects (usually resolve in a few days).
**Example:** Dr. Shankara Chetty treated a patient with 2.5 mg/kg/day — no side effects reported.
**Quick conversion example (for a 60 kg / 132 lb person):**
- Low: ≤30 mg/day
- Medium: 60 mg/day (≈5×12 mg tablets or 1 teaspoon liquid)
- High: 120 mg/day
- Very High: ≥150 mg/day
Many anecdotal reports exist of long-term daily use (months to over a year) with no serious toxicity, but individual responses vary.
Always work with a knowledgeable clinician, especially if you have pre-existing conditions (e.g., vision issues or glaucoma). This is for educational purposes only.
Share to spread awareness — information is power. 💊 Kindly follow me for daily updates. Thank you.
🇺🇦 La liste d’attente de quatre ans pour l’achat de superyachts est entièrement composée de fonctionnaires ukrainiens...
C’est ce qu’a révélé Stephen Kuhn, fondateur de la société Take America Back Inc.
« Je viens de parler au téléphone avec un fabricant de superyachts, et les commandes des fonctionnaires ukrainiens et de leurs familles sont déjà programmées pour les quatre prochaines années. Des centaines de millions de dollars en superyachts, tous provenant d’un seul pays. Pendant ce temps, les contribuables occidentaux au Canada, au Royaume-Uni, en Europe, en Amérique et en Australie financent tout cela », a-t-il déclaré.
« Ils ramassent les gens dans la rue pour les envoyer au front, les mobilisent dans l’armée, et les gens se suicident pour ne pas aller à la guerre. Pendant que les fonctionnaires achètent des superyachts. C’est la plus grande opération de blanchiment d’argent de l’histoire moderne », a ajouté Kuhn.
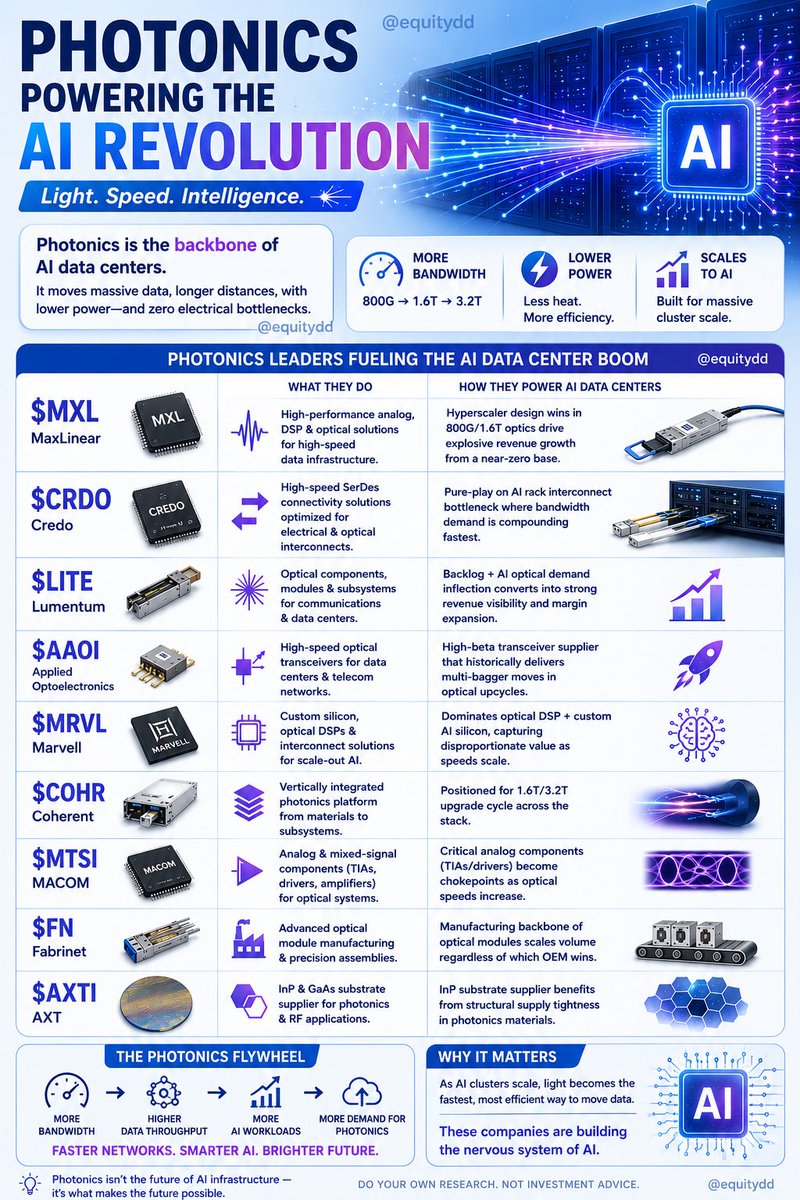
Six themes the street is sleeping on for H2 2026. Everyone's chasing the AI chips. The alpha is in the physical bottlenecks and the next frontiers.
1/ CPO — Co-Packaged Optics**
Optics moves onto the chip package — less power, less heat. Market still prices these as boring telecom names. SV is privately funding optical startups right now. That's the signal.
$LITE $COHR $AVGO $MRVL $MTSI $CRDO $ALAB $TSEM $FN $POET
**2/ 800VDC Power Semis**
NVIDIA is killing the 48V bus entirely. Direct 800V-to-rail. The GaN + SiC makers who enable it become critical infrastructure.
$NVTS $MPWR $ON
**3/ Physical AI — Humanoids & Robotics**
OEMs are private, actuators sit in China/Japan. The US owns the picks and shovels — brain, eyes, motion, magnets.
🧠 $NVDA $QCOM $AMBA
👁 $CGNX $INVZ
⚙️ $NOVN $MOG.A
🧲 $MP
🤖 $TSLA $TER $SYM
**4/ Glass Substrate / Advanced Packaging**
Organic substrates are dead for next-gen. Glass is the only path to HBM4 + CPO at scale. 2026 is year one of production.
$ONTO $GLW $CAMT $FORM
**5/ Space**
Launch costs cratered 90%+. Defense budgets pivoted to orbit. SpaceX IPO is the gravitational pull for the whole sector.
$RKLB $LUNR $PL $KTOS $TDY
**6/ Quantum**
The inflection year — labs to real revenue. IonQ just became the first $100M+ revenue quantum name. ⚠️ Highest beta here by far — speculative sleeve only, size accordingly. These names move 10-15% on no news.
$IONQ $RGTI $QBTS $QUBT $IBM
The component layer reprices first — always. $VPG tripled before anyone talked humanoids. Same pattern plays out across every one of these.
Not financial advice. Do your own work.
Ride the Vertical. Short the Blowoff.
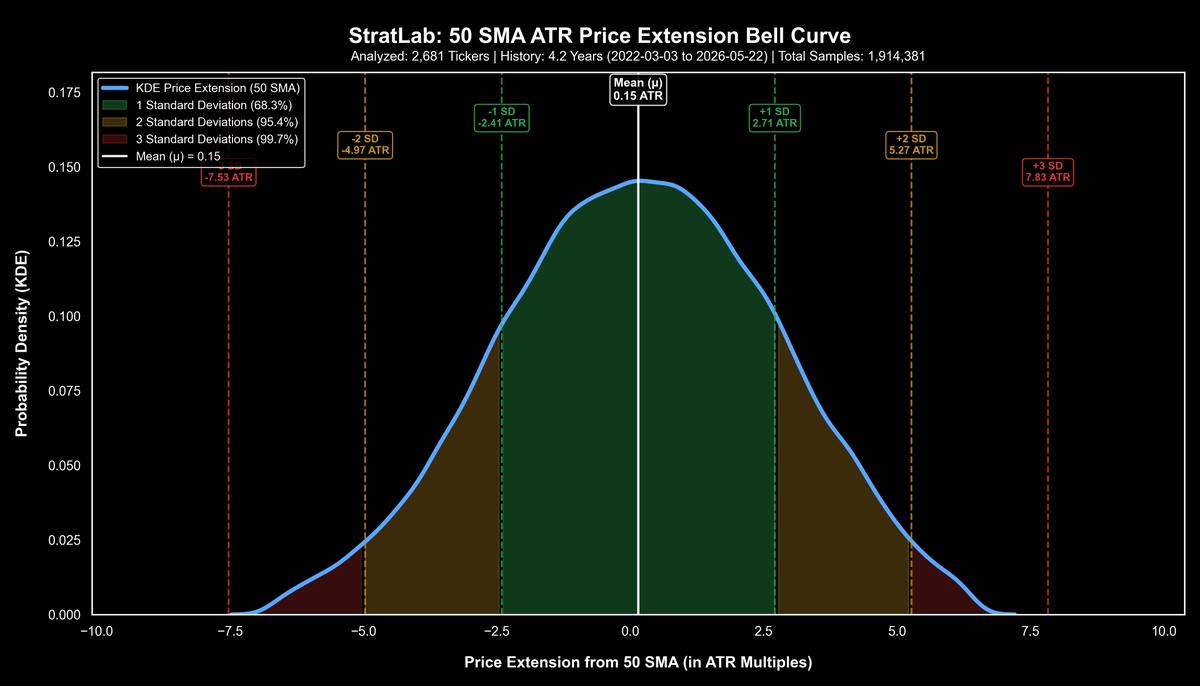
🧵 THREAD: ATR Extension - From Heuristic to Empirical P
1/ Backtested @jfsrev 8x ATR heuristic for the 50 SMA across ~2,700 tickers with nearly 5 years of data.
The result? It's not just a rule of thumb. It's statistically correct.
Here's what the data says ��
Your banana from Ecuador has more deuterium than an apple grown in Hungary.
This isn't a small difference.
It's built into the biology of where the plant grows.
Gábor Somlyai, molecular biologist & cancer researcher:
"In the equatorial area, rain deuterium concentration is 155 ppm. As we go toward the poles, surface water deuterium decreases."
Tropical fruits grow in high-deuterium water.
They carry that load into your cells.
But it goes deeper than geography.
Plants fix carbon dioxide through different pathways — C3, C4, and CAM.
C3 plants (wheat, spinach) deplete deuterium more. Lower load.
C4 plants (corn, sugar cane) sit closer to 150 ppm. Higher load.
CAM plants — like pineapple — can actually concentrate deuterium above ambient levels.
So pineapple isn't just tropical.
It's actively accumulating deuterium through its own metabolism.
Human populations evolved eating the food grown in their region — drinking the water of their latitude.
That food matched their biology.
Today someone in Norway eats bananas from Ecuador, oranges from Spain, pineapple from Costa Rica.
Every one of those choices shifts the average deuterium burden upward.
Eat local. Eat seasonal. Match food to the geography your biology evolved in.
Not complicated in principle.
Just largely ignored.
🚨 THE ENTIRE AI BOOM MIGHT BE BUILT ON FAKE REVENUE.
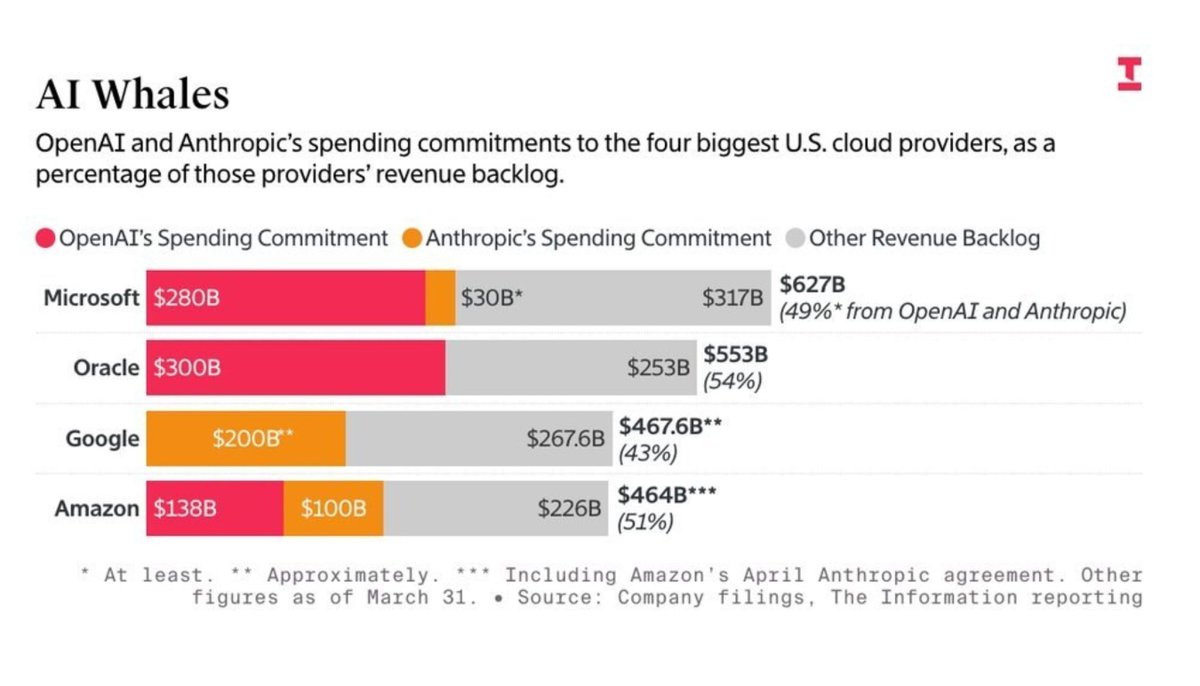
Latest corporate filings show that OpenAI and Anthropic alone make up over half of the entire $2 trillion future cloud backlog held by Microsoft, Oracle, Google, and Amazon.
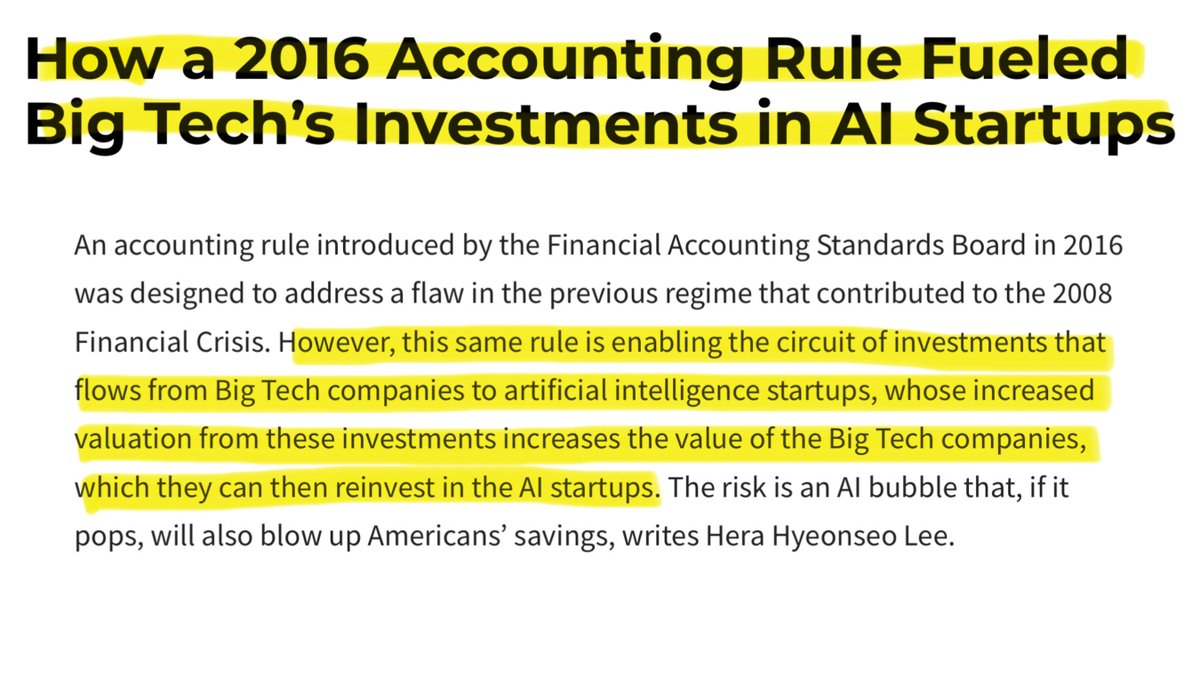
This massive pipeline is actually being created through a circular accounting trick called a round trip revenue loop.
But how it works ?
A tech giant gives billions of dollars to an AI startup as an "investment". But hidden in the contract is a strict rule forcing the startup to hand that exact same money straight back to the tech giant to rent their computer servers.
Look at the documented case of Microsoft and OpenAI.
When Microsoft invested $13 billion into OpenAI, it didn't just give them cash; it gave them "cloud credits" to use Microsoft servers. OpenAI used those exact credits to train its AI models, and Microsoft then turned around and recorded that server usage as brand new "cloud revenue" from a customer.
The tech giant is literally paying itself with its own money and calling it a sale.
This is why OpenAI’s annual cloud bill has ballooned to over $60 billion, double its actual revenue of $25 billion, kept alive solely by this recycled funding loop.
Anthropic runs the exact same play, spending $2.66 billion on Amazon Web Services in just nine months, which was basically 100% of all the money it earned at the time.
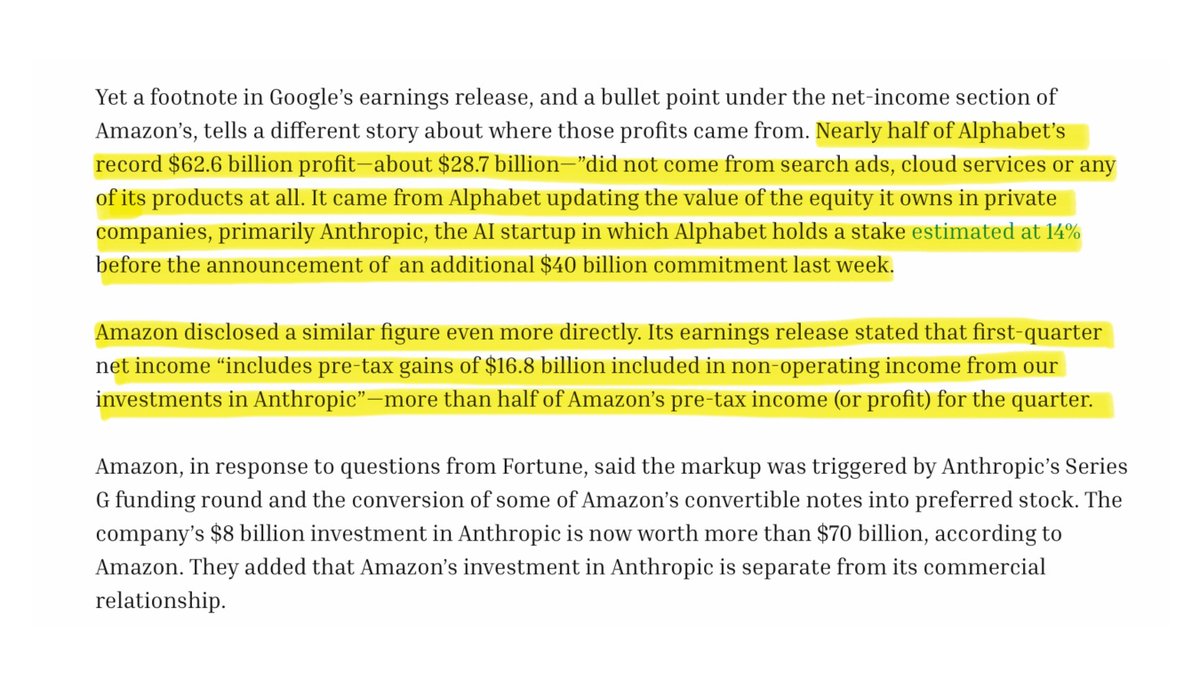
This manufactured demand triggers a second accounting trick where tech giants book massive paper profits. Every time a startup gets a higher value from a new funding round, the tech giant updates the value of its investment on its books and counts that unearned paper gain as direct profit.
In Q1 2026, Alphabet reported a record $62.6 billion profit, but $28.7 billion nearly half, was just a paper markup on its Anthropic investment. In the same quarter, Amazon reported $30.3 billion in profit, but $16.8 billion of it was just an Anthropic paper gain.
While Amazon reported record profits, its actual free cash flow collapsed 95% to just $1.2 billion because it had to spend $44.2 billion in real cash to build physical data centers.
This has created a massive danger where these giant companies rely heavily on just one or two unstable startups. Microsoft has 49% of its $627 billion future backlog tied to OpenAI, while Oracle has an incredible 54% of its entire $553 billion pipeline relying on OpenAI alone.
This perfectly mirrors the 2001 dot-com crash when Global Crossing and Qwest Communications swapped identical fiber-optic network capacity with each other just to book fake sales.
Qwest had to erase $1.4 billion in fake income, and Global Crossing went completely bankrupt.
The only difference is that the dot-com swaps were illegal, but today's AI loop is fully legal under current accounting rules.
This legal loop inflates tech company stock prices, forcing automatic retirement accounts and index funds to buy even more of these tech stocks. It is a self feeding loop where investments, sales, and stock prices all go up on paper without the AI technology ever making real cash profits.
Let me break down my $ARM trade because this has been my biggest winner of 2026 so far.
This trade perfectly explains why I care so much about RS names, Stage 2 trends & buying pullbacks in true leaders instead of trying to bottom fish garbage.
My original buy on $ARM came off the 138 pivot months ago after recognizing the Stage 1 → Stage 2 transition taking place. Then yesterday, after getting stopped earlier this week, I re-entered right at LOD off the 21EMA reclaim, and now today we’re closing around 255.
My $ARM 250c 18 Jun contracts went from 6.80 → 30.50 for +349% in basically 1 day… while still having over a month left of expiration.
But what’s important is NOT the gain itself.
It’s WHY I was watching this name so aggressively in the first place.
Let’s start with the overall market:
Monday:
market closed red → $ARM closed green.
Tuesday:
market closed red → $ARM closed green.
Today:
market closed green → $ARM closed green.
Do you see what I’m looking for there?
That’s relative strength, and that’s one of the first things my eyes immediately gravitate toward every single day. If the market is pulling back, chopping, or struggling and a stock REFUSES to break… that tells me institutions are likely still aggressively supporting price.
And this becomes even more important when you compare it against the actual semiconductor ETFs themselves.
Monday:
$SMH + $SOXX losed red → $ARM closed green.
Tuesday:
$SMH + $SOXX closed green → $ARM closed green.
Today:
Everything moved higher → $ARM continued moving higher aggressively.
That’s leadership behavior + strong stocks don’t just outperform weak markets… they often outperform their own sectors too.
That’s a huge footprint I look for.
"Relative strength first, setup second."
Once I identify a true leader, THEN I start stalking execution opportunities around the chart structure itself.
Now let’s talk positioning because this matters massively.
$ARM broke out of a massive IPO/multi-year base earlier this year. I talk constantly about Stage 1 → Stage 2 transitions because those are usually the names institutions continue accumulating for months once the trend properly develops.
Most traders wait until the stock is already massively extended and obvious before becoming interested. I’m trying to identify the shift while the stock is still transitioning...
That’s why my first major entry came near 138.
The stock was:
- tightening
- reclaiming key pivots
- showing relative strength
- healthy volume patterns
+ institutions were involved
Once a true Stage 2 trend begins, I want to buy pullbacks aggressively because healthy trends usually continue trending.
That’s where the 9/21EMA setup becomes incredibly important for my process.
Yesterday’s re-entry came from $ARM pulling back into the 21EMA after expansion... weak hands started panicking, momentum cooled slightly, then buyers immediately stepped back in and defended price intraday.
That’s the exact slingshot setup I talk about constantly.
> strong stock + strong theme + strong group
> controlled pullback + defined risk.
> momentum + reclaim confirmation
And another important thing:
I wasn’t buying weakness hoping it would reverse.
I waited for momentum to CONFIRM first!
That’s why I entered off LOD once price started reclaiming and proving buyers were stepping back in. If I’m wrong, I get stopped quickly...but if I’m right, I can know quickly and immediately begin building cushion while the trend continues working.
My process summed up is...
1) identify true leadership
2) wait for healthy pullbacks into support
3) execute once momentum turns back up
4) have the emotional ability to actually hold the winner
That’s the hard part.
Because most people either:
- chase emotional extension candles
- panic during normal pullbacks
- or take profits way too early
These Stage 2 leaders just continue grinding higher for months because institutions physically cannot build full positions in a single day. Arm’s continued expansion into AI data centers, CPUs, and energy-efficient compute infrastructure has kept institutional demand extremely strong throughout 2026.
again...
My goal is 2...
find leadership,
buy controlled weakness,
manage risk aggressively,
then let the winners run.
That’s what I repeat every single week!
Chart: $ARM.