Tesla on important triangle support, great risk-reward.
Key support near $136, a break below would invalidate this view, bullish confirmation above $235 and $295 for even higher levels. https://t.co/NwwBGJv9qr
The $USDJPY has recently reached important resistance near 164 which was its highest level since 1986 ! This looks like a completed a-b-c pattern and I would be expecting further downside as long as 164 resistance is holding. Next supports in the 151 area but first real target near 143. I could eventually see a drop all the way to the 124-130 area where lies the real solid technical support.
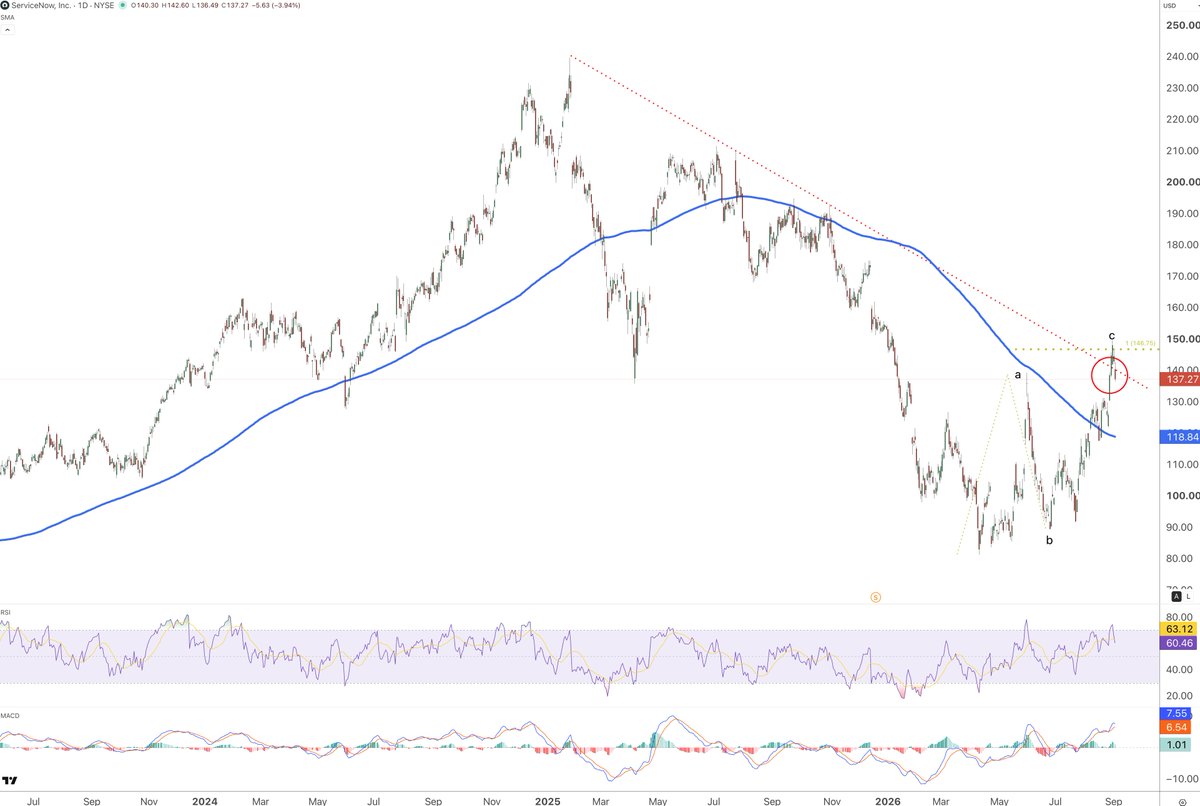
ServiceNow $NOW reacting negatively at C=A region which is not particularly bullish. Also it is re-entering to the downside its bearish trendline. Only a break above the recent high near $150 would make me bullish on this one for now.
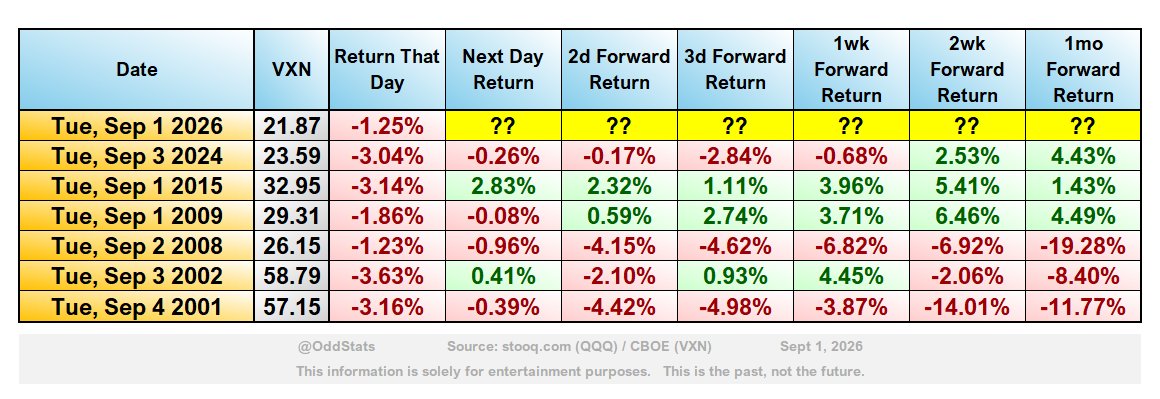
QQQ has just kicked off September with a -1% day. As noted earlier, this is now the 7th time that's ever happened and EVERY SINGLE TIME was on a Tuesday.
Anyway, all you care about is how QQQ did the rest of the month and you know how I hate to disappoint you.
The Canadian banking sector, represented by the ETF $ZEB.TO seems to have reached a very important level in the $79 area which is the confluence of multiple Fibo projections.. This chart is very extended and due for at least a consolidation but most probably a good correction. The chart looks like a completed 5 waves structure since 2009 (creation of the ETF). So as long as $79 resistance is holding, we see a pullback towards top of wave (3) in the $63 area. Supports below are at $57 and $43.
Nasdaq100 $QQQ seems to be toppish as long as it trades below $748. A break below $700 would open further drop towards next support near $638. A break above $748 would invalidate this view. MACD and RSI are both showing loss of momentum.
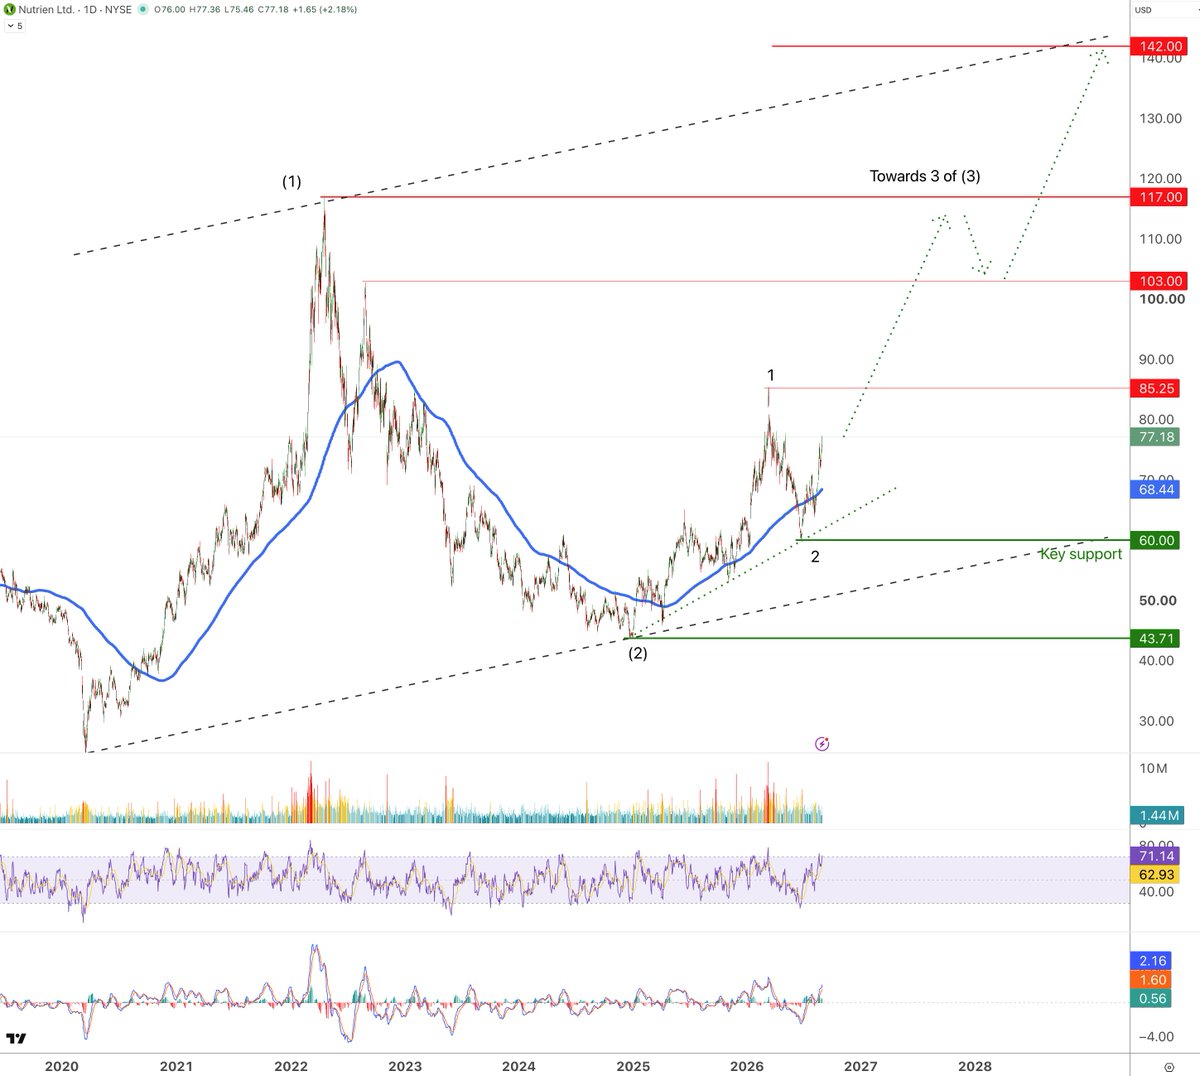
Nutrien $NTR looking very bullish, in its wave 3 of (3) with potential to retest the all time high near $117 and even reach $142 eventually. The wars and major El Nino are creating a perfect storm for agriculture commodities and fertilizers stocks. This pattern is valid as long as key support of $60 is holding. Next support below near $44.
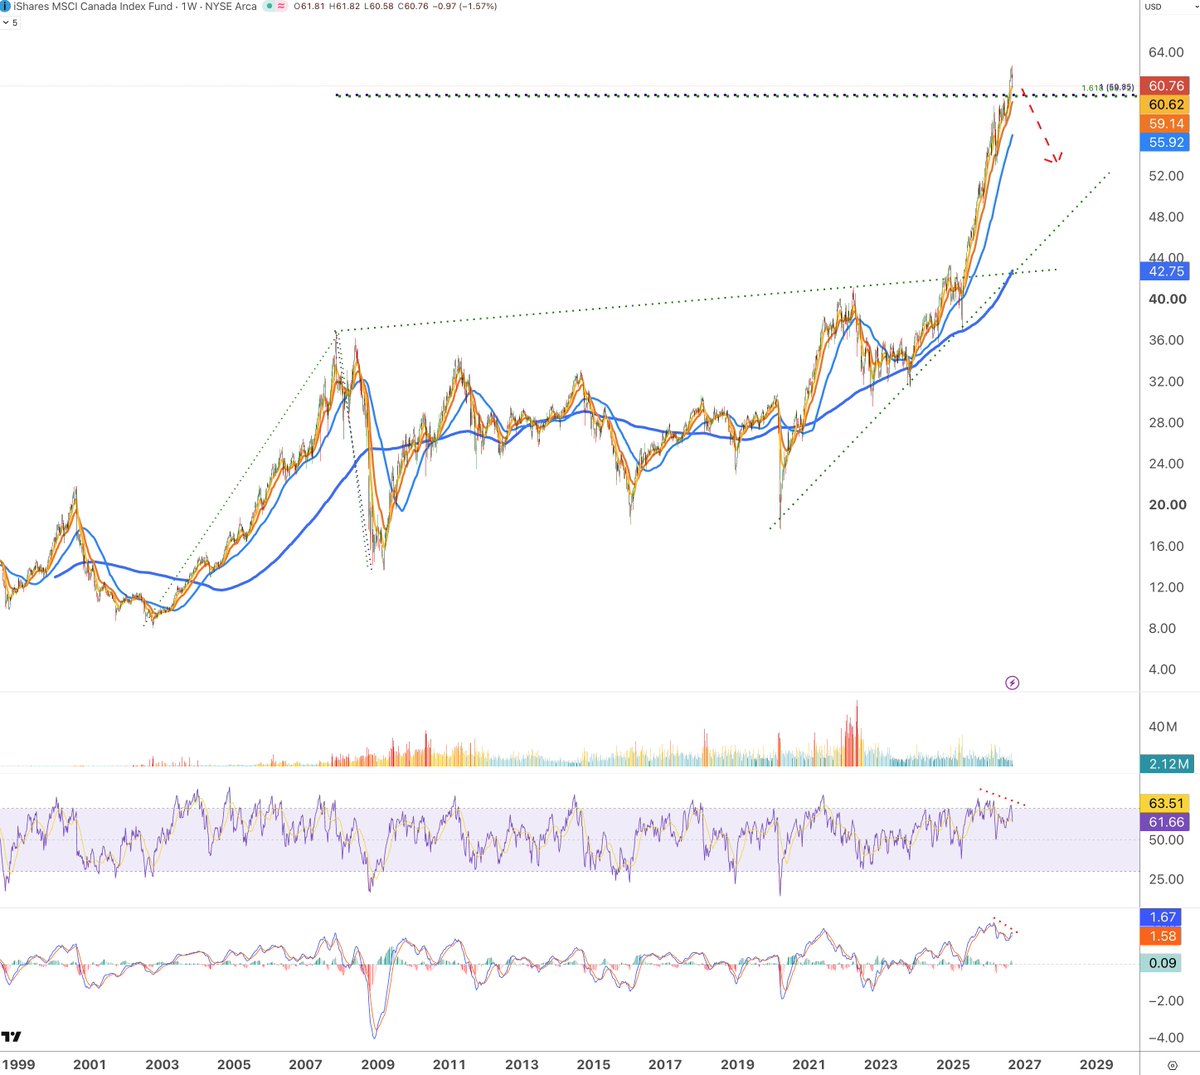
Canada ETF $EWC is trading just above important Fibo projections in the $60 area. Looking very much extended with divergence in the RSI and MACD in weekly chart. With the tarifs war climbing to another level, the slowdown of immigration rate and the poor performance of the economy (due mostly to over bureaucracy and too lefty politics), it is hard to see the Canadian market going much higher in the near term. The only thing that can help it is the strength of the commodities market.
@LindaRaschke Does anyone knows what the little blue dots above the oscillator represent ? I guess it is divergence but how is it calculated in this case ? Thanks
Hydrograph Clean Power ($HGRAF) seems to be getting closer to start its most impulsive wave III. A break above $5.34 area will validate this count (while a break below $3 area would invalidate it). There is a confluence of the 50 and 200 SMA acting as supports in the $4 area and a bullish reverse Head & Shoulders pattern in play with a target in the $8 area, near the all time high. The company just announced that they are expecting "both larger purchase orders and long term supply agreement within calendar 2026". Depending on the source, there seem to be around 12 days of average volume to cover the shorts.
@elonmusk Wondering if SpaceX and Tesla are considering adding some graphene from Hydrographe Clean Power $HGRAF to make their products stronger and lighter !
Hydrograph Clean Power ($HGRAF) seems to be getting closer to start its most impulsive wave III. A break above $5.34 area will validate this count (while a break below $3 area would invalidate it). There is a confluence of the 50 and 200 SMA acting as supports in the $4 area and a bullish reverse Head & Shoulders pattern in play with a target in the $8 area, near the all time high. The company just announced that they are expecting "both larger purchase orders and long term supply agreement within calendar 2026". Depending on the source, there seem to be around 12 days of average volume to cover the shorts.
Don't want to sound too bearish, but Nvidia seems due for a pullback. I count 3 completed waves since 2000. A break above $237 would invalidate this view. Supports lie near $164 and $87. A break above $237 would mean we're in wave extensions, making it much harder to identify resistances or targets. Below is a monthly log chart. Not financial advice — solely my opinion.