@descb600f Hi Des, the yellow bars in the solar radiation chart represent sunshine hours, defined as periods when direct solar irradiance exceeds the threshold of 120 W/m².
https://t.co/YUuTT2LUjw
@RallyeI Bonjour, le problème a été résolu et les appareils sont de nouveau en ligne. Nous nous excusons pour le désagrément et vous remercions de votre compréhension.
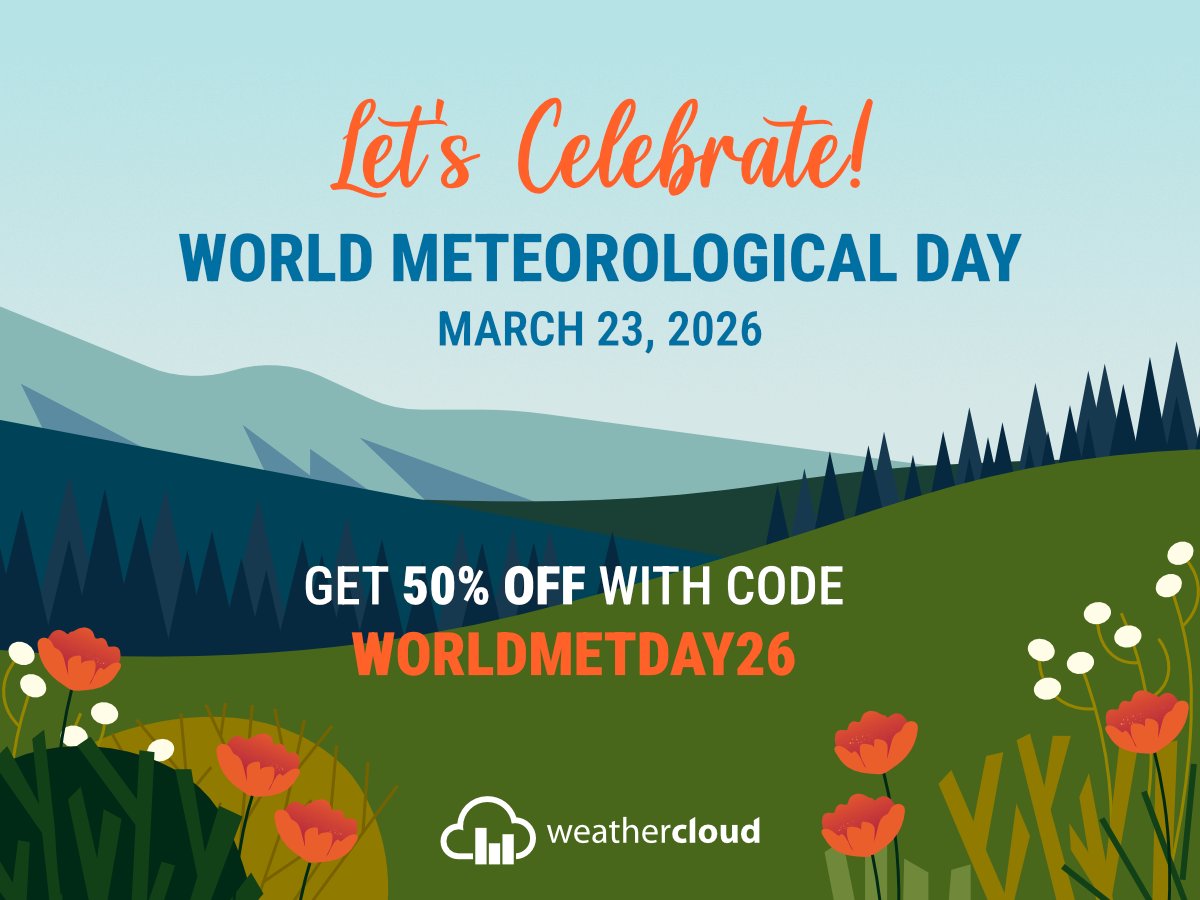
🎉 Happy World Meteorological Day 2026!
🎁 Today we want to celebrate this amazing science with you by giving a special gift!
🎟️ Use code WORLDMETDAY26 at checkout to enjoy 50% off your first year on any plan.
🔥 Only 100 coupons available. Grab yours before they’re gone!
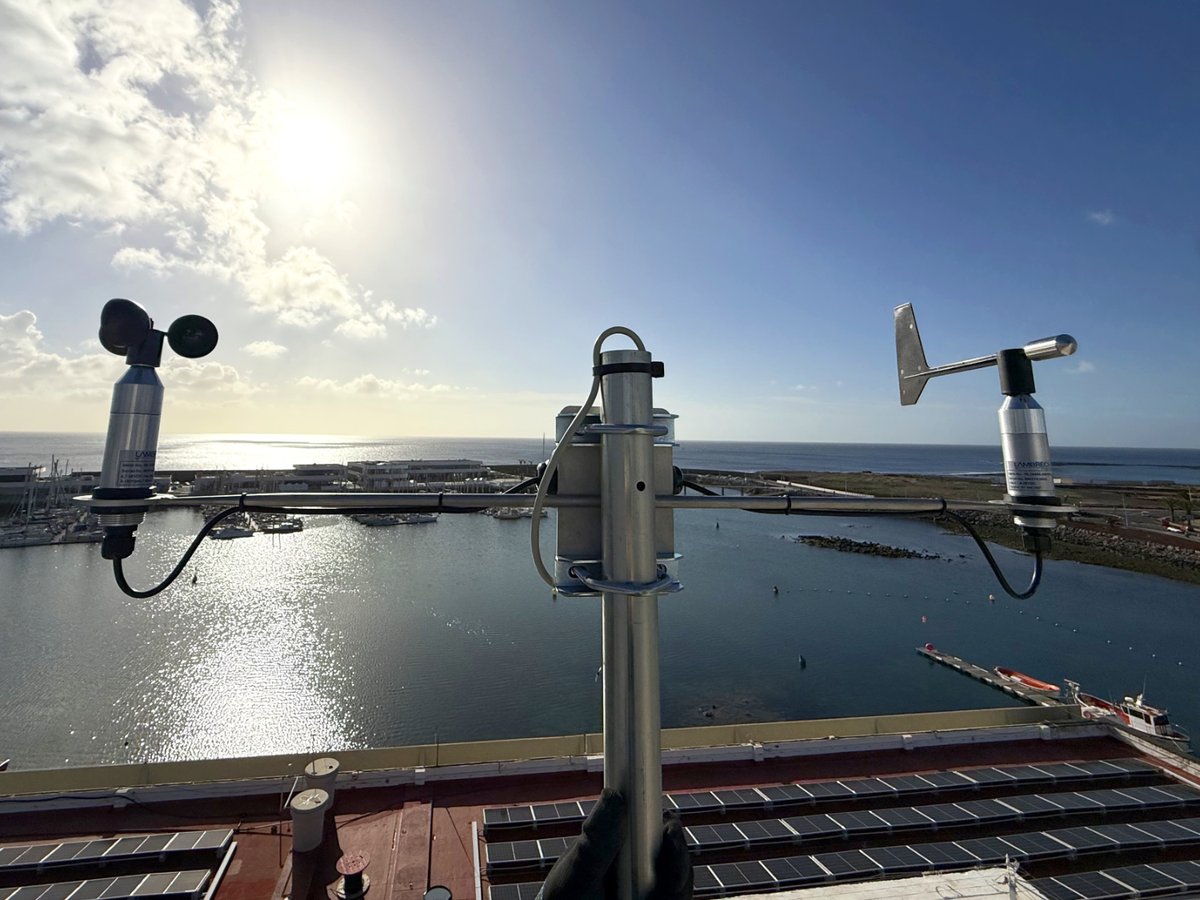
🌊 We installed a 3R AWS100 weather station at the Canary Islands Maritime-Fisheries Vocational Training Institute!
🌦️ Allows real-time monitoring of environmental conditions and sharing data with the nautical community and the public on @Weathercloud.
https://t.co/XcOChF8ndl
@jjbustoss Hi Juanjo! Our map focuses on real-time device data, but you can find daily stats like maximum temperature and total rain on each device’s individual page.
That said, we'll definitely share your suggestion with the relevant team for consideration. Thanks!
@LlVGolf Our status notifications are automated, but point taken! Definitely a bit of 'stating the obvious' on our part during a storm. Hope your power and Wi-Fi are back up soon. Stay safe out there!
@Hoogen1950 Hi Jaap, it looks like your screenshot isn’t from Weathercloud. Do you notice the same issue when checking your device on our platform? Thanks.
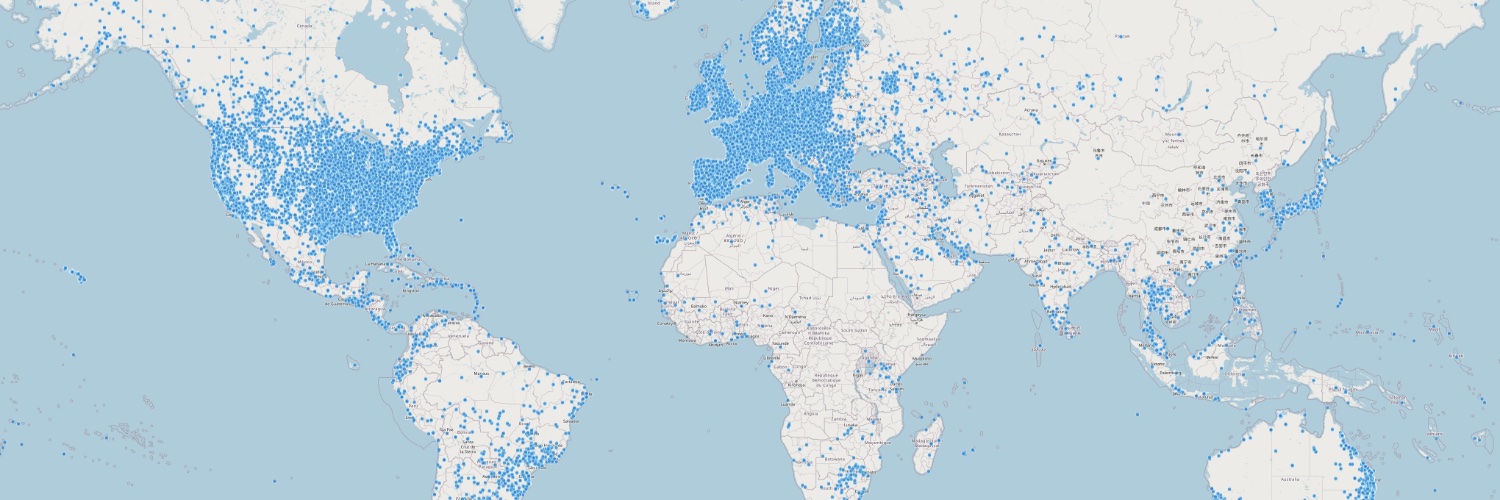
🌍 Watch the new #Weathercloud Map in motion!
✅ Filter devices by type
✅ Overlay forecast layers
✅ See the wind flow
✅ View isobar lines
✅ Switch from hyperlocal to global in seconds
🚀 All the data you need, in one powerful interactive map.
https://t.co/RELEc6oo2L
🚀 #Weathercloud14 is live!
�� Map Layers – Filter devices & explore global forecasts
📷 Weathercam – Overlay weather data on your webcam
⏳ Time-lapse – Relive a day of weather in seconds
🔗 Ocean Controls – Upload data via Modbus Gateways
More info: https://t.co/fNBGuT1Clq
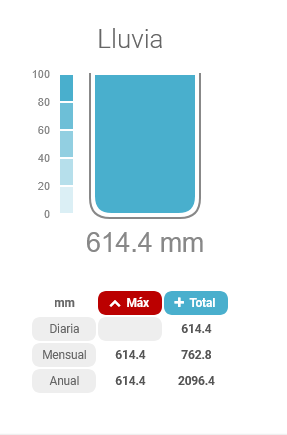
Que barbaridad!!!
Se superan los 600l/m2 en 24h en Grazalema
Estación https://t.co/BLUlGo42s1
La Precipitación Media ANUAL en Logroño es de 400/500 l/m2
Por lo tanto en un solo día, ha caído en Grazalema, más agua que en todo un año en Logroño
#BorrascaLeonardo#rioatmosferico
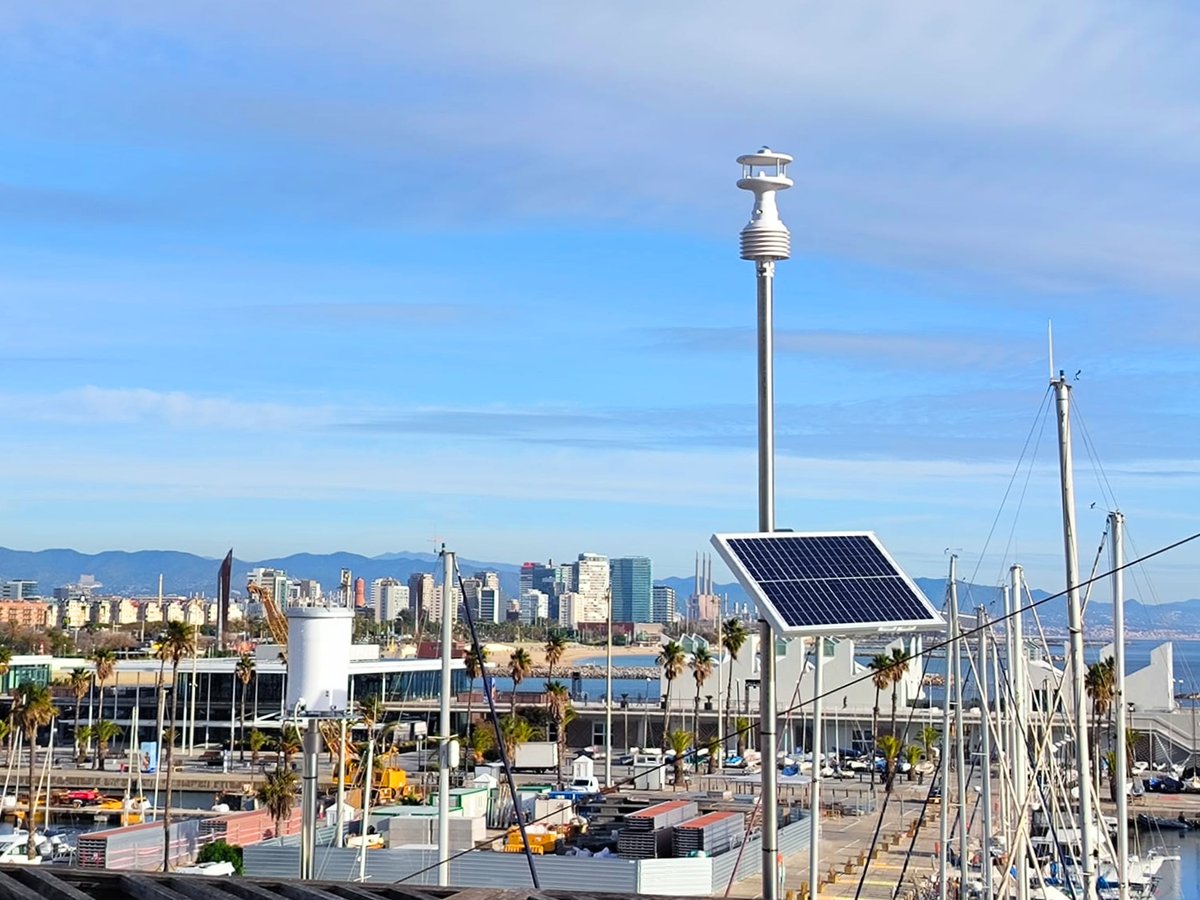
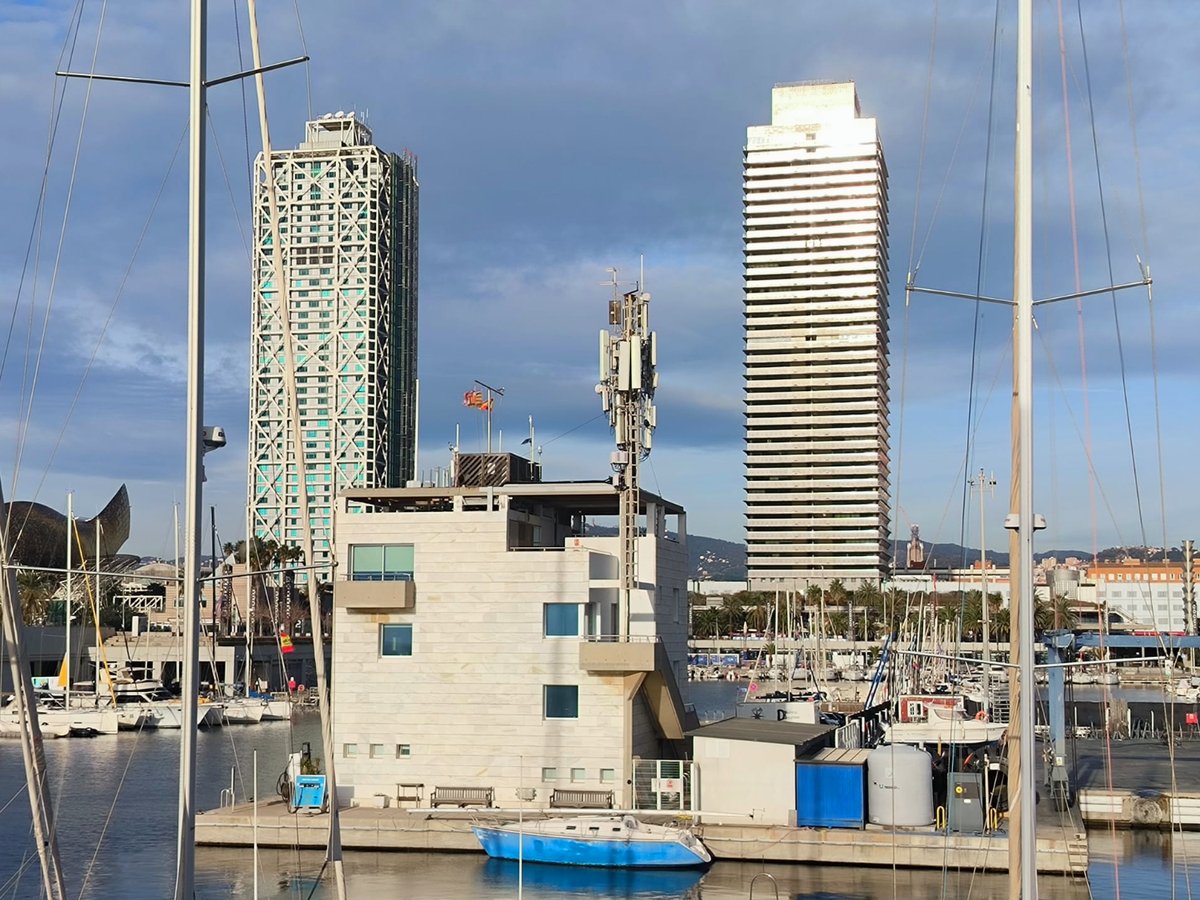
✅ We’ve kicked off 2026 by installing a high-performance 3R AWS100 weather station at @PortOlimpic!
📊 It features solar power and 4G communication for remote data transmission to @Weathercloud.
Dashboard: https://t.co/qsRmdk2yCX
Read more: https://t.co/C8gr8s8o4z
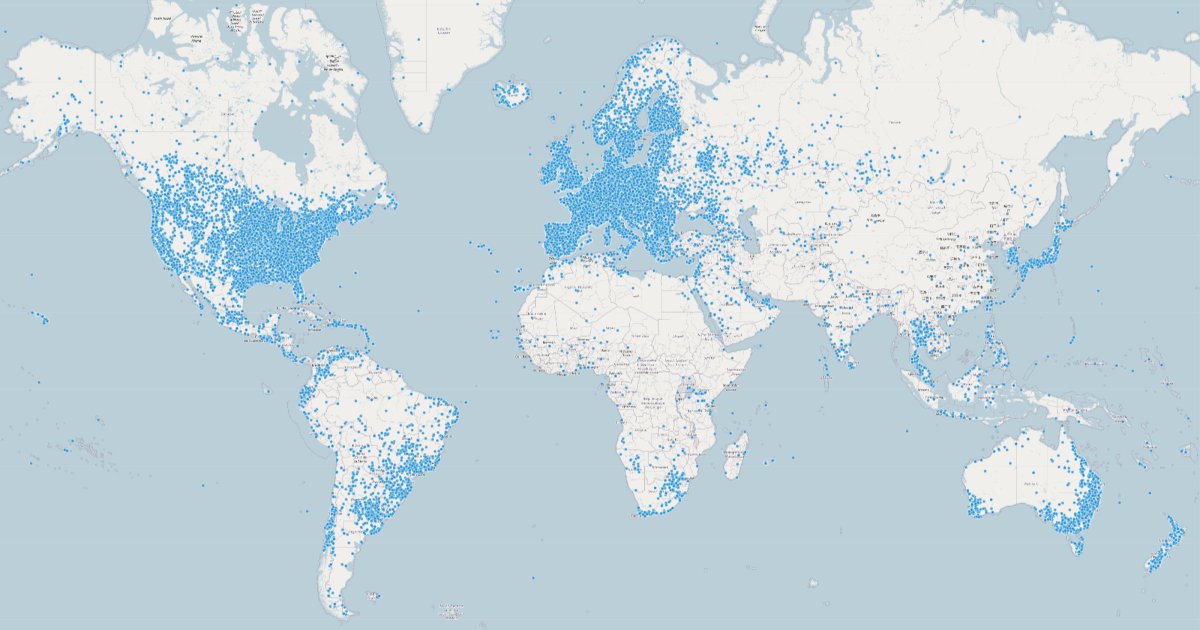
🚀 Wow! 4,000+ new devices joined #Weathercloud this holiday season!
🎁 It seems a lot of you found the coolest gift under the tree!
🏆 Top 5: 🇫🇷 France 🇩🇪 Germany 🇨🇿 Czech Rep 🇺🇸 USA & 🇬🇧 UK.
🌍 See your new neighbors: https://t.co/0eC0u1YZIm
💙 A huge welcome to everyone!
❄️ Prawdziwa zima na wsi w Kluczach! 🌡️
Aktualnie na zewnątrz -6.7°C, wilgotność 90%, lekki wiatr i prognoza na śnieg. Śledźcie na żywo dane z mojej stacji pogodowej – temperatura, opady, wiatr i więcej, prosto z pola!
Sprawdźcie tutaj: 👇 https://t.co/dGJRUtkhU0
🎄Happy Holidays from #Weathercloud!
💙 A huge thanks to our global community of observers for an incredible 2025. Your passion keeps Weathercloud thriving every single day.
⏳ Get ready: 2026 is set to be our biggest year with game-changing features and surprises!
🥳 Cheers!