I love Python but i would never use it for data analysis. The UI (including command syntax) of Stata is superior.
UI is important, especially for new users.
Which is why we’re building a Stata-like data package in Julia: https://t.co/UNX2prD3tq
@BHarrap much quicker on the M1 etc chips in my limited experience. @MattCowgill forcibly had to switch from Mac to Windows recently so might have a better idea
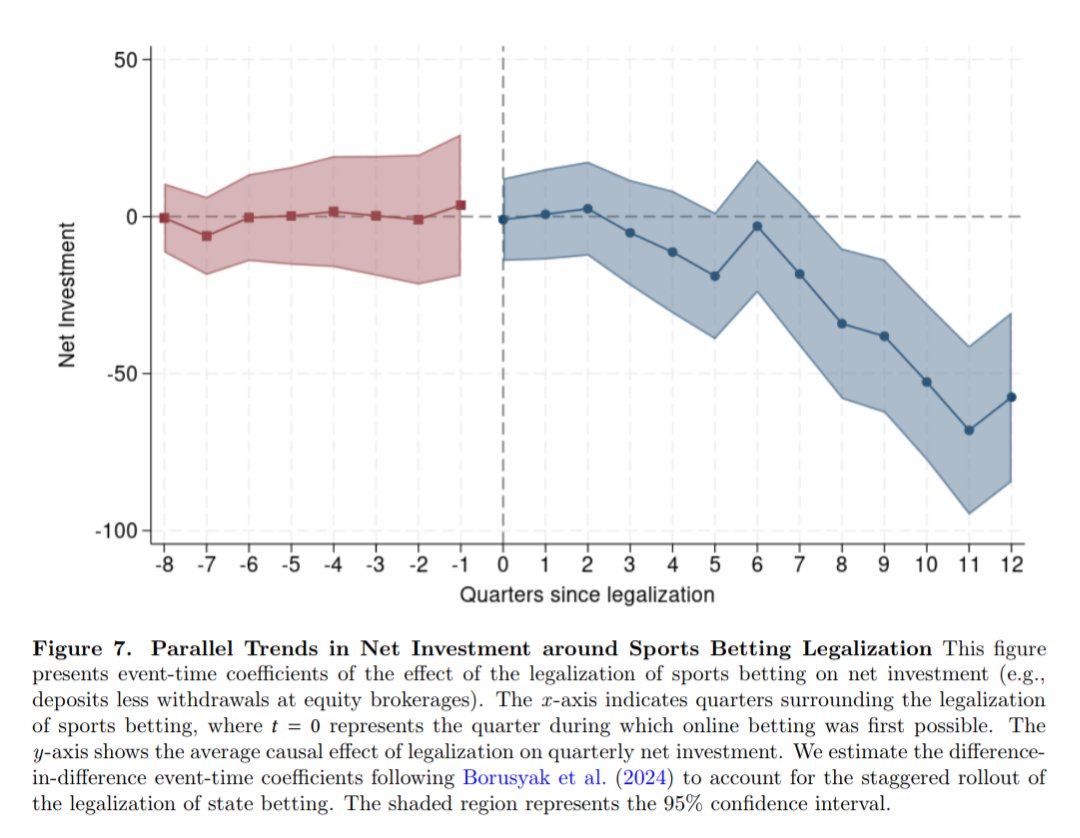
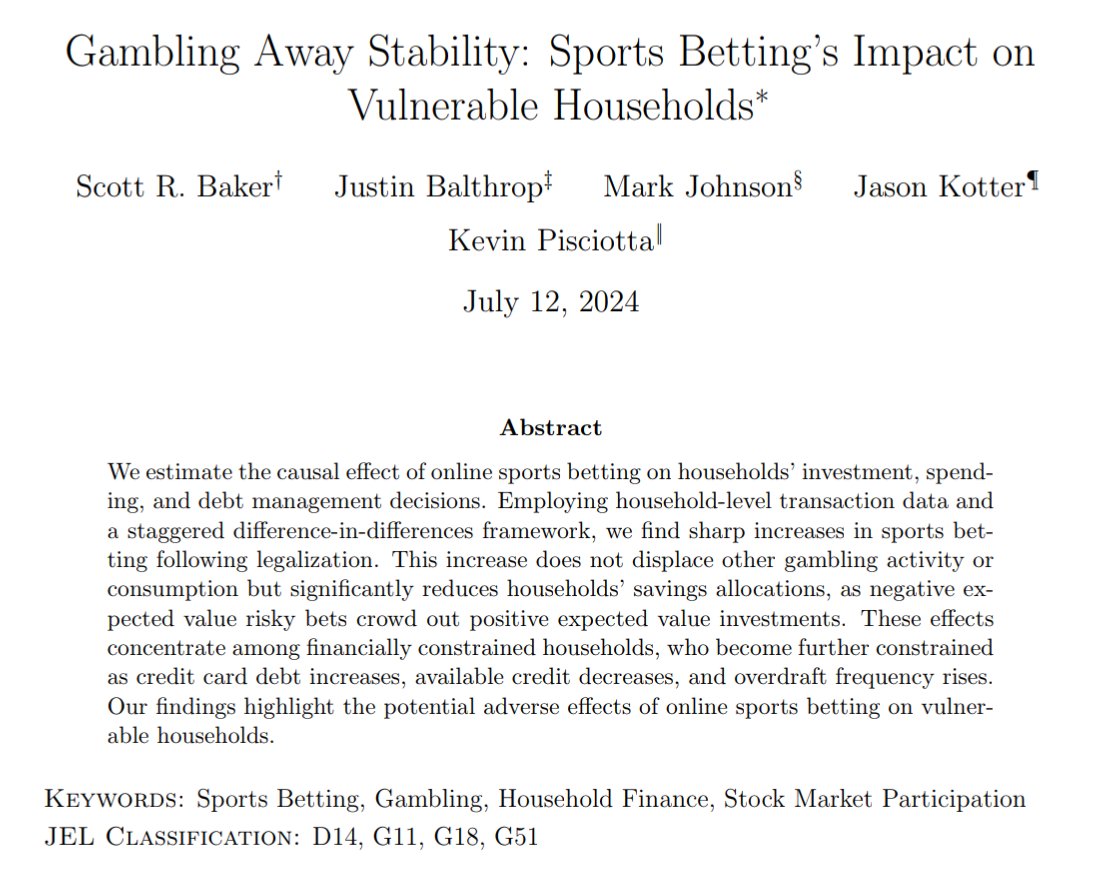
Sports betting legalization reduces net investments of households by nearly 14% overall.
$1 of sports betting reduces net investment
by over $2, increases credit card debt, but has no effect on participation in lotteries or other online gambling
outlets.
https://t.co/k8JRSvj6Da
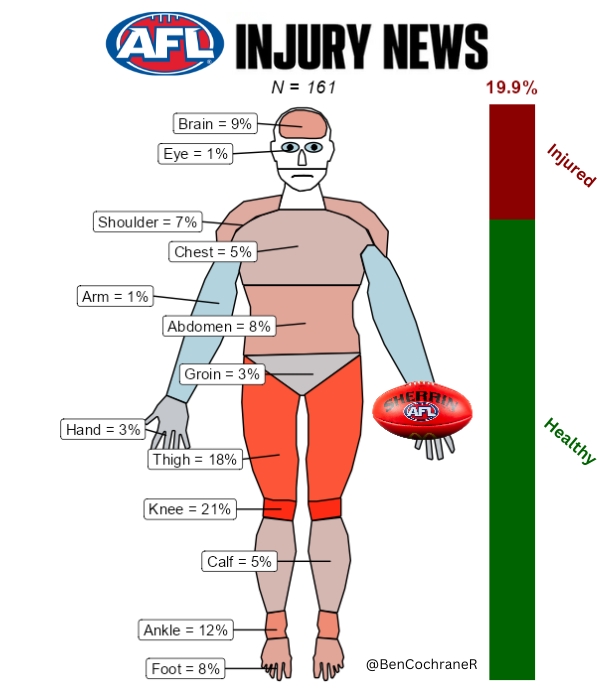
What could a visual illustration of #AFL injury lists🩹look like?
Of the 161 current injured players (19.9%), injuries most commonly occur in the thighs (hamstring and quad), ankles, knees and brains.
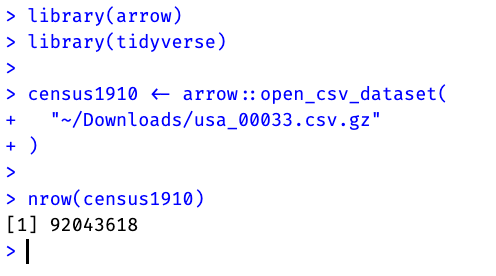
The pace of innovation in data science is astounding (and I'm not talking about AI!)
2 years ago, I wrote in my book about analyzing a 92 million row @ipums CSV file using a database in #rstats
Now: just point `arrow::open_dataset()` at it and ` collect()` what you need!
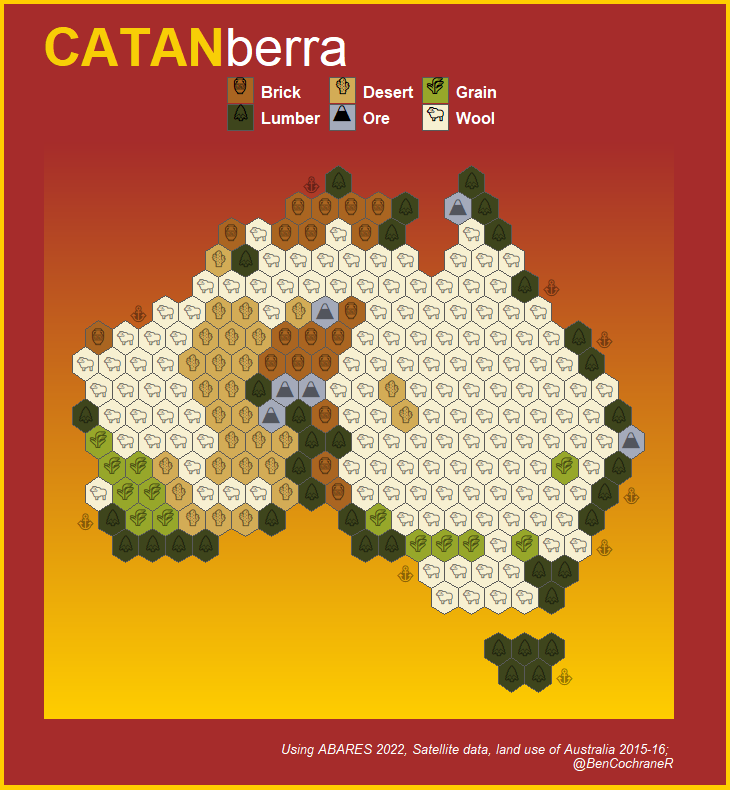
What would Australia look like as a geographically accurate #Catan board?
Thanks to satellite imaging and #rstats we are able to create 'CATANberra' - see how below 🧵