Every move in the market leaves footprints.
We’re turning Footprints into a dedicated home for US equities.
Expect high-conviction swing setups, smart-money activity, technical analysis, and research-backed market opportunities.
No random calls. No unnecessary noise.
Just price action, research, and disciplined execution.
Welcome to the next chapter of Footprints.
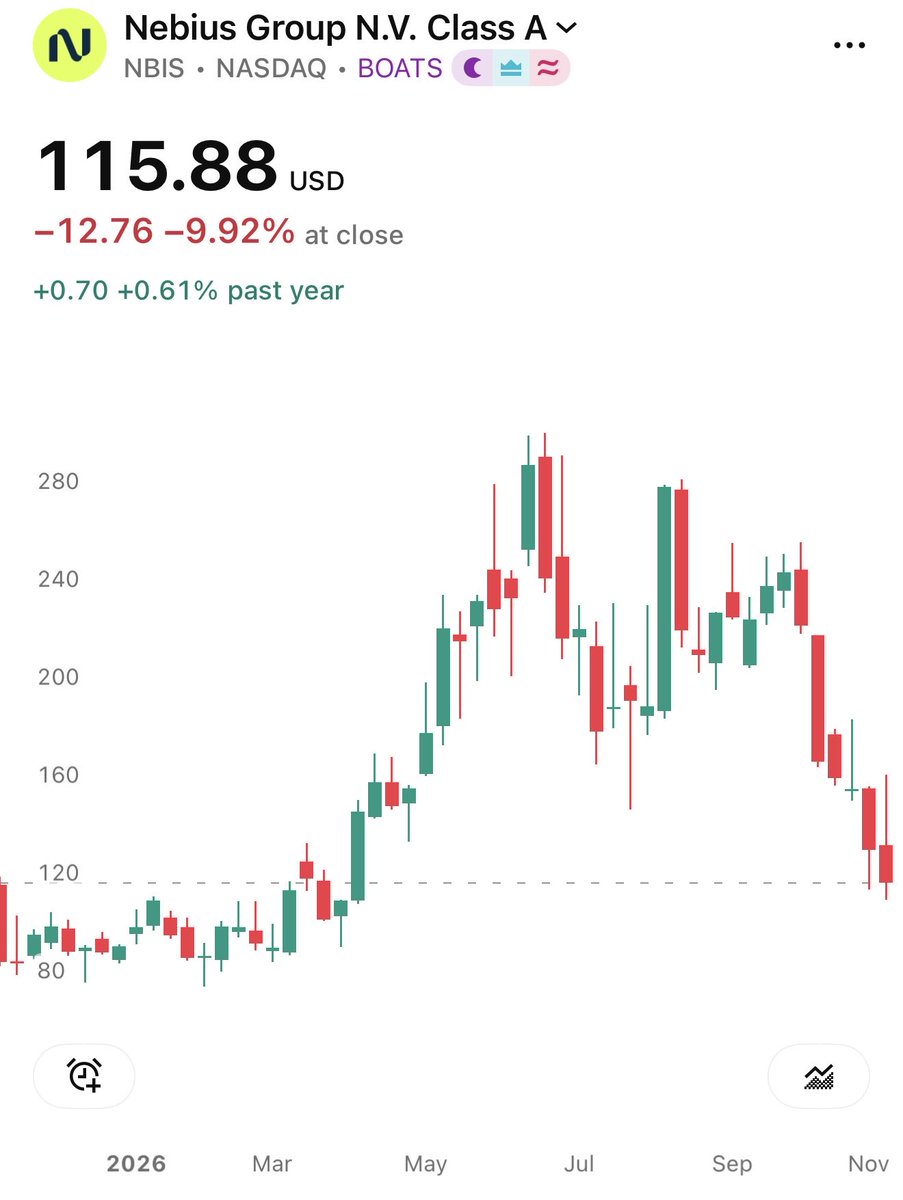
$NBIS — A critical area for the next major move.
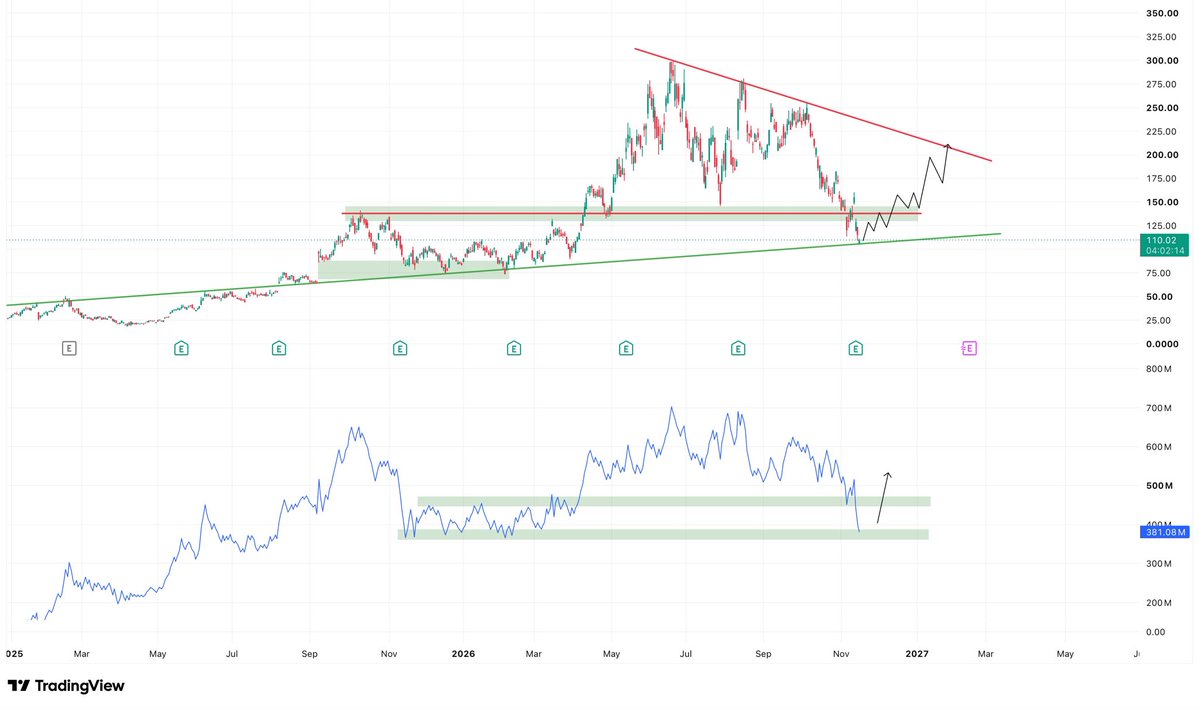
Price has now retraced from nearly $300 to the $110 region, where the long-term ascending trendline comes into play.
What’s particularly interesting is the OBV.
While price is testing a major structural support, OBV has returned to a historical demand region around 380M, an area that previously preceded significant accumulation.
That doesn’t confirm buyers have returned, but it creates an interesting confluence between price structure and volume.
I’m watching for a recovery toward $140–$150 first. Reclaiming that zone would strengthen the case for a larger move toward $180–$200, where the descending resistance becomes the next major test.
A sustained breakdown below $110 would weaken this thesis considerably.
The next move depends on whether this is the beginning of renewed accumulation or simply a pause in the broader downtrend.
$NBIS — A critical area for the next major move.
Price has now retraced from nearly $300 to the $110 region, where the long-term ascending trendline comes into play.
What’s particularly interesting is the OBV.
While price is testing a major structural support, OBV has returned to a historical demand region around 380M, an area that previously preceded significant accumulation.
That doesn’t confirm buyers have returned, but it creates an interesting confluence between price structure and volume.
I’m watching for a recovery toward $140–$150 first. Reclaiming that zone would strengthen the case for a larger move toward $180–$200, where the descending resistance becomes the next major test.
A sustained breakdown below $110 would weaken this thesis considerably.
The next move depends on whether this is the beginning of renewed accumulation or simply a pause in the broader downtrend.
STOCK MARKET FEAR IS FADING
CNN Fear & Greed Index: 35 (Fear)
• 1 month ago: 18 (Extreme Fear) • 1 week ago: 31 • Yesterday: 38
Still fear, but climbing out of the panic zone.
Nvidia earnings this week will decide the next leg.
Buy fear, sell greed. Just don't rush it.
NSTITUTIONS HAVE BEEN LOADING $NBIS FOR 18 MONTHS.
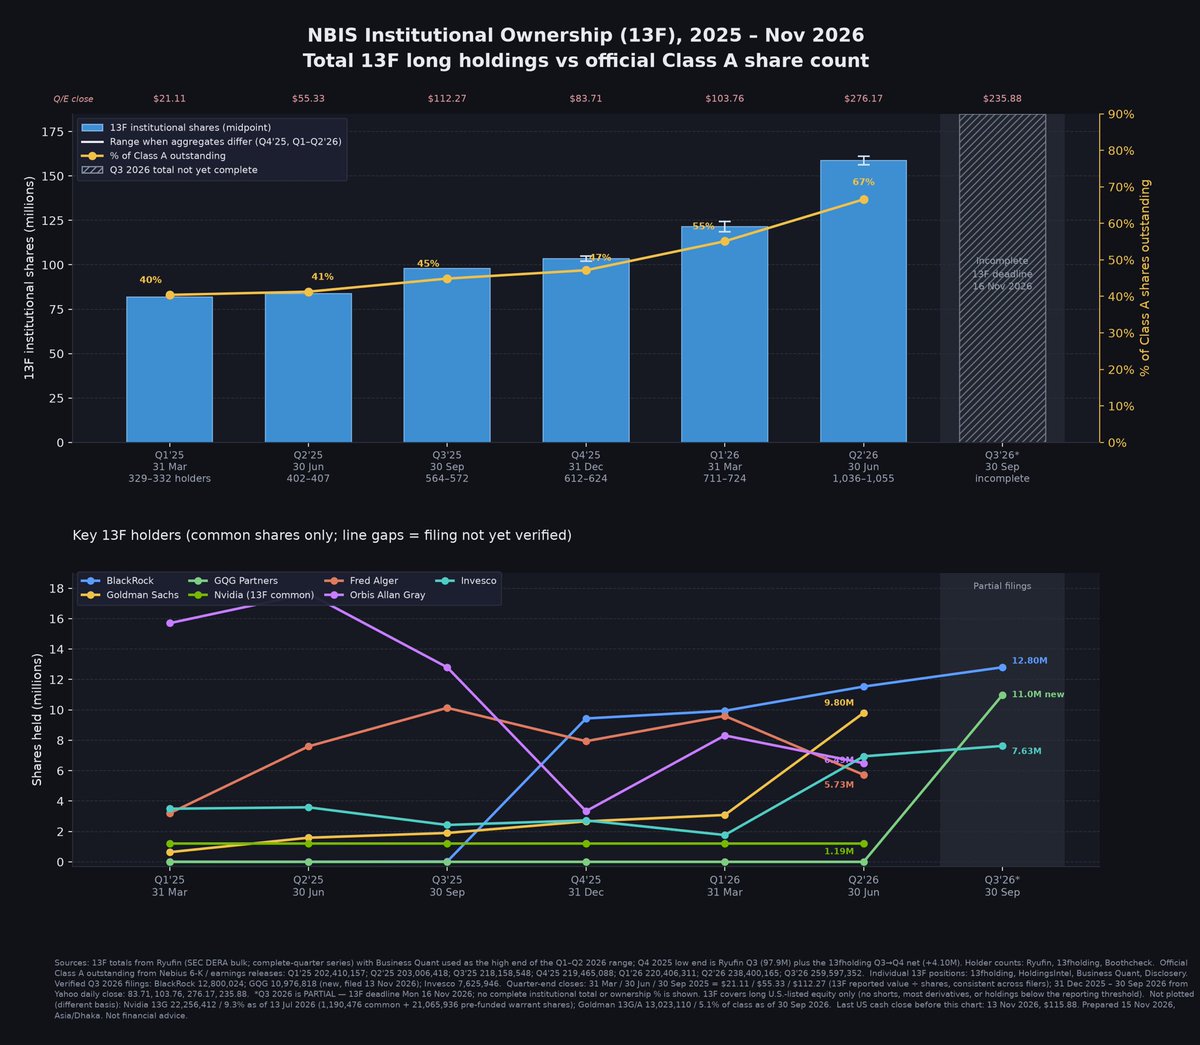
13F data, Q1 2025 to Q2 2026:
• Institutional shares: 82M → 159M
• Ownership: 40% → 67% of Class A
• Holders: 330 → 1,050+
BlackRock went from almost zero to 12.8M shares. Goldman tripled to 9.8M. GQG opened a fresh 11M stake in Q3.
Price dumped after earnings, but the big money was building positions the whole way.
Q3 filings finish today. Watch who held through the dip.
Smart money moved
Everyone's watching $NVDA revenue on Tuesday.
I'm watching 3 other things:
1. Receivables
2. Customer concentration
3. Guidance from a brand new CEO
A revenue beat means nothing if the cash isn't coming in.