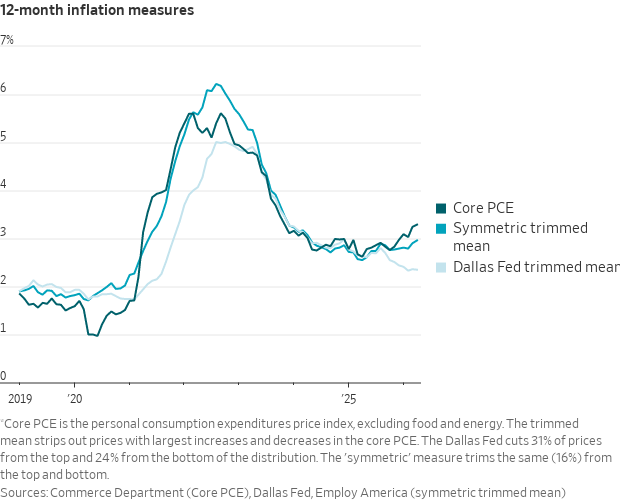
Fed Chairman Kevin Warsh wants to pay more attention to measures of inflation that strip out the most extreme price moves each month.
Several versions exist, all running below core. The most widely cited is the Dallas Fed's, at 2.3% in April (vs. 3.3% for core PCE).
빅 4 하이퍼스케일러 1분기에 건설중 자산(CIP)으로 묶여 있는 투자지출액이 전년 동기 약 2~3배 증가
1. 구글
2026년 1분기 (3/31): 약 654억 달러
2025년 동기 (3/31): 약 221억 달러(yoy +196%)
2. 메타
2026년 1분기 (3/31): 611억 달러
2025년 동기 (3/31): 약 295억 달러(yoy +106%)
3. 아마존
2026년 1분기 (3/31): 약 420억 ~ 440억 달러
2025년 동기 (3/31): 약 240억 달러(yoy +75%)
4. 마소
2026년 1분기 (3/31): 약 480억 달러
2025년 동기 (3/31): 약 230억 달러(yoy +100%)
대부분이 데이터 센터 공사 지연과 칩 선구매 영향에 따른 재고 증가로 추정됨.
많은 사람들이 고정관념 때문에 제대로 숫자도 확인 안하는 “빅 5 하이퍼 스케일러의 순현금 = 현금성 자산(Cash+Marketable Securities) - Debt”
X에서 보면 다들 숫자도 확인 안하고 빅 5 하이퍼 스케일러들은 돈 많아 아직 여력있어라고 하는 글들이 많음.
팩트 : 보유 순 현금 고작 $54B + 분기 평균 영업현금흐름 $170B X 3 - 2-4분기 CAPEX 지출 $550B = 연말 남는 보유 현금 $14B
여기에 자사주 매입, 배당금까지 제외하면 추가 부채발행 없이는 보유 순현금이 마이너스 될 가능성이 높음.
그냥 무작정 고정관념에 갇혀 있으면 큰일 납니다.
AI CAPEX가 언제까지 가능할지 다시 계산해보면, 핵심은 생각보다 단순함.
빅테크가 돈이 없어서 못 쓰는 구간은 아직 아님.
진짜 문제는 현금 부족이 아니라,
“이 정도 CAPEX를 시장이 몇 년까지 용인할 수 있느냐”
“AI 투자가 실제 영업현금흐름으로 언제 돌아오느냐”
이 두 가지임.
현재 AI CAPEX의 1차 지출자는 Amazon, Microsoft, Alphabet, Meta 같은 하이퍼스케일러임.
대략 2026년 계획 기준으로 보면,
Amazon 약 2,000억 달러
Microsoft 약 1,900억 달러
Alphabet 약 1,850억 달러
Meta 약 1,350억 달러
빅4 합산 AI/데이터센터 CAPEX가 대략 7,000억 달러 이상까지 올라온 구조임.
그런데 이 회사들의 현재 영업현금흐름 체력을 합산하면 대략 6,000억 달러 초중반 수준임.
즉 2026년부터 이미 중요한 변화가 생김.
빅4 합산 CAPEX가 영업현금흐름을 초과하기 시작한 것임.
이게 바로 시장이 불안해하는 지점임.
다만 여기서 “AI CAPEX 버블 끝났다”로 바로 가면 안 됨.
왜냐하면 빅테크는 아직 현금이 많고,
차입 여력도 있고,
자사주 매입을 줄일 수도 있고,
이미 고객 약정과 클라우드 백로그도 쌓여 있음.
그래서 2026년 지출은 거의 확정적이라고 봄.
2026년은 이미 계획화된 구간임.
장비 주문, 데이터센터, 전력, GPU, 네트워크, 냉각, 서버 램프업이 이미 진행 중이라 이걸 갑자기 멈추기 어려움.
2027년도 가능성이 높음.
Microsoft, Amazon, Google 모두 아직 AI 컴퓨팅 수요가 공급보다 많다는 식으로 말하고 있음.
즉 2027년까지는 “돈이 남아서 쓴다”라기보다,
수요가 너무 강해서 먼저 지을 수밖에 없는 구간에 가까움.
문제는 2028년부터임.
2028년은 AI CAPEX가 불가능한 해가 아니라,
투자자들이 슬슬 ‘그래서 이게 돈이 되냐?’라고 본격적으로 묻기 시작하는 해라고 봄.
2024~2026년에 지은 데이터센터와 GPU 클러스터가 2027~2028년에 실제 매출로 연결되어야 함.
Azure AI, AWS AI, Google Cloud AI, Meta 광고 AI, 엔터프라이즈 AI, inference 사용량이 현금흐름으로 들어와야 함.
그게 보이면 CAPEX 사이클은 더 감.
그게 안 보이면 2028년 이후부터는 속도 조절 압력이 커질 수 있음.
그래서 내가 보는 진짜 판정 연도는 2029년임.
2029년에도 CAPEX가 계속 증가하는데,
AI 매출 회수는 약하고,
FCF는 눌리고,
감가상각은 커지고,
전력/리스/부채 부담이 커진다면
그때는 시장이 “더 지어라”가 아니라 “이제 회수 보여줘라”로 바뀔 가능성이 높음.
결론적으로 정리하면 이렇다.
2026년: 지출 가능. 이미 확정에 가까움.
2027년: 지출 가능성 높음. 수요와 고객 약정이 아직 강함.
2028년: 가능은 하지만 FCF 압박이 본격화되는 구간.
2029년: 1차 판정 구간. AI 매출 회수가 증명되어야 함.
2030년: 조건부 가능. CAPEX 증가율이 둔화되고 AI 영업현금흐름이 따라와야 함.
내 생각에 가장 중요한 문장은 이거임.
AI CAPEX는 2028년에 갑자기 끝나는 구조는 아님.
하지만 동시에,
2030년까지 지금 같은 속도로 계속 가속할 수 있는 구조도 아님.
2026~2027년은 증설의 시간이고,
2028년은 검증의 시작이고,
2029년은 판정의 해가 될 가능성이 높음.
그래서 투자 관점에서는 단순히 “AI CAPEX가 유지되나?”보다 더 중요한 질문이 있음.
CAPEX의 성격이 어디로 이동하느냐임.
초기에는 GPU와 서버가 핵심이었음.
하지만 시간이 갈수록 병목은 전력, 냉각, 네트워크, 광통신, CPO, 데이터센터 인프라, 효율화 쪽으로 이동할 가능성이 높음.
AI CAPEX가 무한히 증가하지는 못해도,
그 돈이 흘러가는 병목은 계속 바뀔 수 있음.
그래서 나는 이 사이클을 이렇게 보고 있음.
2026~2027년: AI 인프라 증설 사이클
2028년: CAPEX 효율 검증 사이클
2029년 이후: 승자 공급망만 살아남는 선별 사이클
결국 중요한 건 하나임.
빅테크가 돈을 얼마나 쓰느냐보다,
그 돈이 어느 병목에서 가격결정력을 만들어내느냐.
개인은 거기에 집중해야 한다고 봄.
투자 조언 아님. 개인 기록용.
‼️US inflation is closing in on a level that has historically been DEVASTATING for stocks:
If inflation crosses 4%, history suggests stocks face significant pain ahead.
TAP IMAGE TO SEE FULL INSIGHT👇
https://t.co/EzLukdVPoh
Say private credit fund X owns loan A marked at 100 & private credit fund Y owns loan B marked at 100, but both X&Y know A&B are really worth 65. So X&Y agree to trade “in and out of loans”. X buys B from Y & Y buys A from X, both at a price of 100 & say “See? NAV’s solid!”
🚨The global single-stock leveraged ETF market is EXPLODING:
Global leveraged and inverse single-stock ETF assets under management (AUM) surged to ~$65 billion, more than DOUBLING since the beginning of April.
The US accounts for ~$46 billion, or ~70% of the total.
This is followed by Hong Kong at $13 billion, which has added +$10 billion in assets over just the last 2 months, and South Korea at $3.3 billion, which listed its first single-stock leveraged products THIS WEEK.
The largest single-stock leveraged ETF in the world is now the 2x Long SK Hynix ETF listed in Hong Kong, with $10 billion in AUM.
To put this into perspective, the first single-stock leveraged ETF in the US was launched in July 2022,
This is an absolutely INSANE MARKET.
⚠️THIS IS ABSOLUTELY INSANE:
Long global semiconductor stocks are now the MOST CROWDED trade among global fund managers, cited by ~73% of respondents in the BofA Global Fund Manager Survey.
TAP IMAGE TO SEE FULL INSIGHT👇
https://t.co/MlUL5s2hUt
US tech stocks are rewriting the record books:
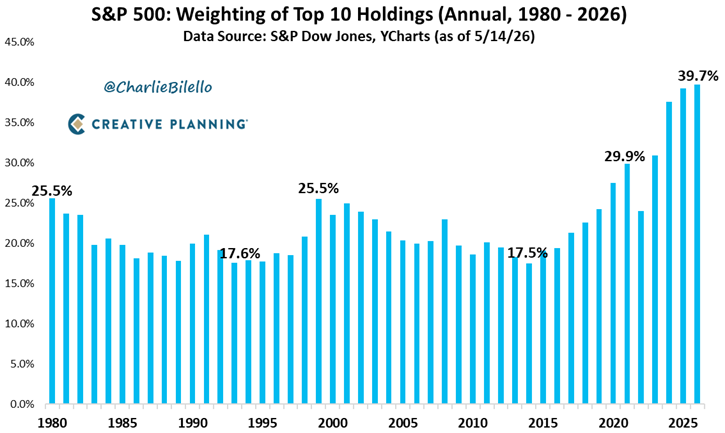
The Information Technology Sector now accounts for 37% of the S&P 500’s market cap, an all-time high.
This percentage has nearly DOUBLED since the 2020 market bottom.
To put this into perspective, the 2000 Dot-Com Bubble peak was 35%.
As a result, the tech sector's market cap is now up to a record $29 trillion.
Technology stocks also account for a record 91% of total US GDP.
Meanwhile, the remaining 10 sectors collectively account for $49 trillion of the $78 trillion in US market capitalization.
The market has never been more driven by one sector.
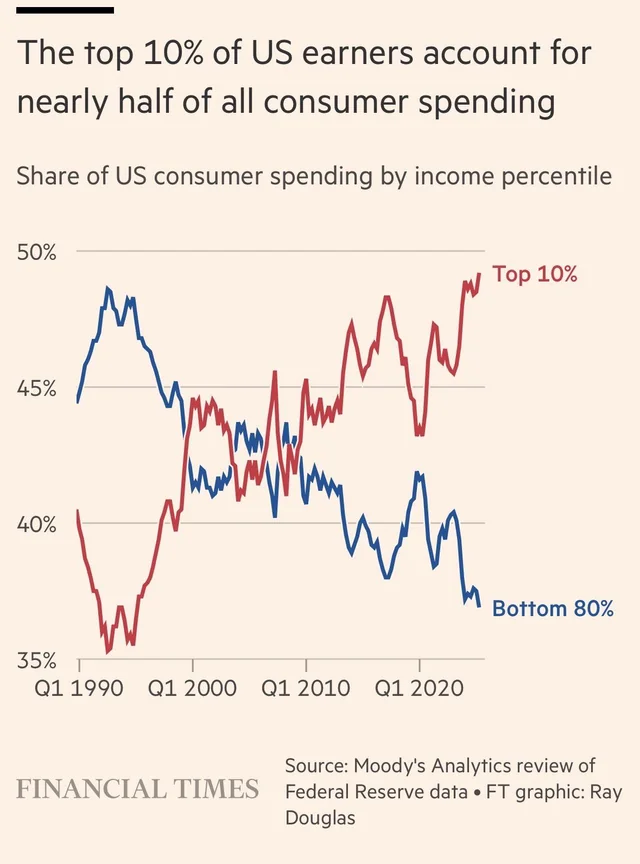
🚨 ONLY 10% OF AMERICANS ARE NOW KEEPING THE ENTIRE US ECONOMY FROM CRASHING.
28 million people are driving 49% of everything Americans spend.
The other 221 million account for just 37%.
This is the highest concentration of consumer spending ever recorded in US history.
Every 1% rise in the stock market increases consumer spending by 0.05%. Markets are up double digits this year.
The entire consumer economy is now a direct function of where the S&P 500 closes every day.
The bottom 80% have nothing left to contribute.
National household debt just crossed $18 trillion. Credit card balances hit a record $1.2 trillion as lower income households borrow just to cover basic expenses against prices that are 25% higher than 2020.
Deloitte projects that a 10% stock market correction would cause real consumer spending growth to fall to just 0.2% in 2027 and drop 1% in 2028.
The 28 million people keeping this economy running are fully invested in the stock market.
The US economy has never been this dependent on this few people. And those people have never been this dependent on the stock market.
US inflation is red hot.
1. CPI Inflation: 3.8%, highest since May 2023
2. PCE Inflation: 3.8%, highest since May 2023
3. PPI Inflation: 6.0%, highest since March 2023
4. Services Inflation: 3.4%, highest since Sept 2025
5. Shelter Inflation: 3.3%, highest since Sept 2025
6. Energy Inflation: 17.9%, highest since Sept 2022
7. Gasoline Inflation: 28.4%, highest since June 2022
Inflation is reaccelerating across nearly every major category of the US economy.
Are you positioned accordingly?
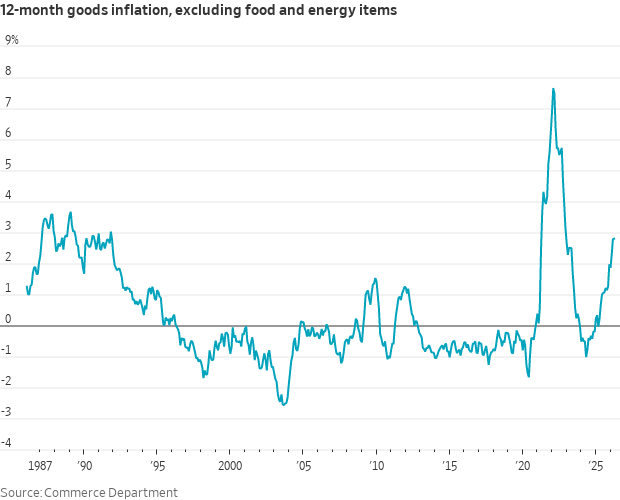
Looking at the components of core PCE in April
Core goods prices rose 0.3% on the month (3.7% annualized rate) and were up 2.8% from a year earlier, which would be the largest such increase in decades if not for the post-pandemic spike of 2021-22.
The S&P 500 has never been more concentrated in just ten stocks than it is today with the biggest US companies representing nearly 40% of the index.
Video: https://t.co/MlNh6to3Qz
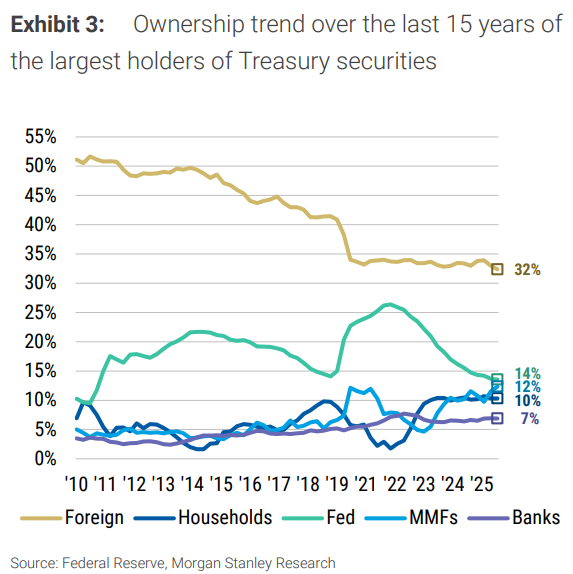
Foreigners are dumping Treasuries since 2010
- 2010 foreign Treasury ownership: 51%
- 2026: 32%
The 2nd biggest holder of US Treasuries is the Fed with 14%, down from 26% in 2021.
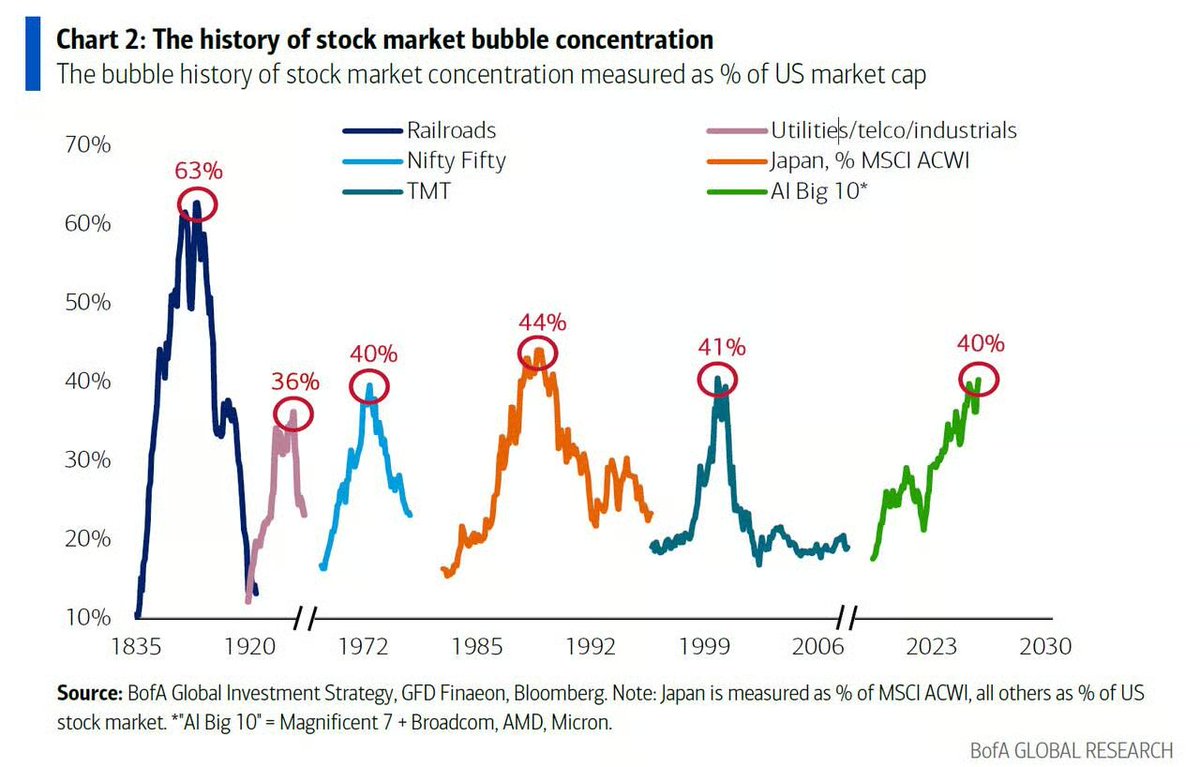
🔴The AI bubble is now larger than almost every market bubble in history:
The 'AI Big 10', comprising the Magnificent 7 plus Broadcom, AMD, and Micron, now accounts for a record 40% of total US stock market capitalization.
This matches the peak concentration of the Nifty Fifty bubble of the 1970s and the 2000 Dot-Com Bubble.
Including the upcoming mega IPOs of OpenAI, Anthropic, and SpaceX, AI-related market concentration would surge to ~48%, surpassing every major bubble on record.
The only bubble in history with greater concentration was the Railroad bubble of the 1880s, which peaked at 63%.
Is the AI bubble near its end, or is there further room to run?
The last 3 major market crashes all coincided with CPI crossing above 3.8%.
Dot-com: −49%.
Financial crisis: −57%.
2022 rate hike selloff: −25%.
CPI is approaching that level again and S&P is sitting near all time highs.