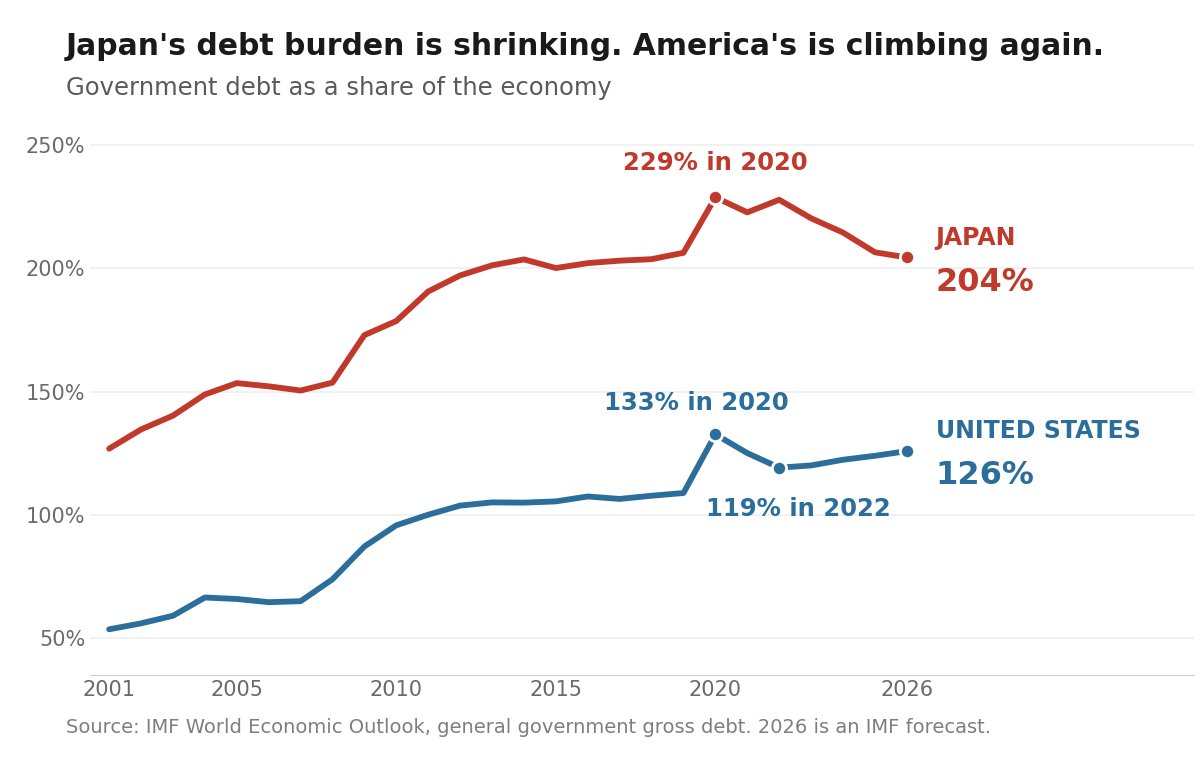
Japan has done something no other big economy has managed. Its debt-to-GDP ratio is falling — from a peak of 229% to 204% — and it didn't repay a thing. Its debt actually rose 11% over those five years.
The method has a name most people never hear: financial repression.
The idea is simple. Keep interest rates below inflation. That's the entire policy.
Think about what a government earns and what it pays. It earns taxes. Taxes are a slice of everything bought, sold and earned in the country, so when inflation pushes up prices and wages, collections rise automatically. Same tax rates, bigger numbers.
What it pays is interest on old debt. If the central bank pins rates down while inflation runs, that cost barely moves.
So the government's income climbs year after year while its debt bill stays flat. Hold that gap open long enough and the ratio has to come down. No spending cuts, no repayment. Just time.
Japan ran exactly this. In 2023, inflation was 3.3% and the Bank of Japan's policy rate was still negative — below zero. Over five years the economy in yen terms grew 20% while debt grew 11%. The ratio fell on its own.
There is a loser, and it isn't foreigners. It's the Japanese saver, whose deposit earned nothing while prices rose 3% a year. The gap between what savers should have earned and what they got is precisely what the government kept. A tax nobody voted on.
Now the catch. This only works if you control your creditors.
Japan does. The Bank of Japan holds 48% of its government's bonds; Japanese banks, insurers and pension funds hold most of the rest. Foreigners hold 8%. When Tokyo suppresses rates, its own institutions absorb the loss. And they stay.
America can't. Foreigners own 31% of US public debt — $9.2 trillion. When Washington let inflation run in 2021-22, the trick began working there too: debt fell from 133% of GDP to 119%. Then the foreign holders did what captive ones can't. They sold, and demanded more to stay. The 10-year yield crossed 5% in October 2023, the highest since 2007. Higher rates on every new bond wiped out the gains, which defeats the entire purpose. The ratio is back at 126% and climbing.
So the one number that decides who can run this play isn't debt-to-GDP at all. It's the net international investment position — what a country owns abroad minus what foreigners own of it. Japan: plus ¥562 trillion, the savings of decades. America: minus $21 trillion. The first country owes itself. The second owes the world.
Views are personal. Not investment advice.
1979: fasting glucose over 140 makes you diabetic.
1997: lowered to 126.
Millions of new diabetics. Same blood.
1997: prediabetes starts at 110.
2003: lowered to 100.
A third of American adults, created by a footnote.
1984: high blood pressure is 160/95.
2017: lowered to 130/80.
American hypertension goes from 32 per cent of adults to 46. Thirty-one million new patients in a morning.
2001: the cholesterol target is 130.
2004: lowered to 100, and to 70 for the high risk.
Statin eligibility expands by millions.
Eight of the nine men who wrote that 2004 update were on the payroll of companies selling statins. They disclosed it only when forced.
1994: a WHO panel invents osteopenia. Bone that is not thin enough to break, given a name and a prescription. Half of older women qualify.
Nobody got sicker on any of those dates. A committee sat down and a number moved.
The threshold drops, the market widens, and the drug is already licensed and sitting in the warehouse.
Your grandfather was healthy at 145/92. You are ill at 132/81.
Nothing about the body has changed. Only the paperwork, and who profits from it.
My heart goes out to everyone who lost bitcoin in the Coldcard hack. That is a real gut punch, and no one should have to go through it.
Seeing a lot of people freaking out and questioning the whole idea of self-custody because of it.
One company made a serious mistake on the one job a hardware wallet has: generating solid entropy for the seed. That hurts so many real people. At the same time, it does not mean self-custody is broken, even though it might feel like it today.
Self-custody is and will always be the point. You hold the keys. No third party that can freeze, lose, or seize your bitcoin. That is what makes this different from the old system.
Also, for many people, a simple single-sig setup does the job well. One seed, written down properly and stored safely. Clear and manageable. Countless people also lose bitcoin through their own mistakes rather than sophisticated attacks. Lost seeds, forgotten passphrases, botched setups. Adding layers of complexity also gives more places to mess up.
If your stack grows or your threat model changes, it off course makes sense to step up. Multi-sig, a strong passphrase, extra entropy measures. Match the complexity to the amount and the risk. That is a smart upgrade path, not a rejection of the simpler tools that work better for a large number of people.
Be careful not to overcorrect. Do not throw away practical self-custody for setups that are hard to maintain, or even worse, hand the keys to someone else who has already proven they can lose them too.
Hold your own keys. Keep the setup as simple as your risk allows. Verify everything.
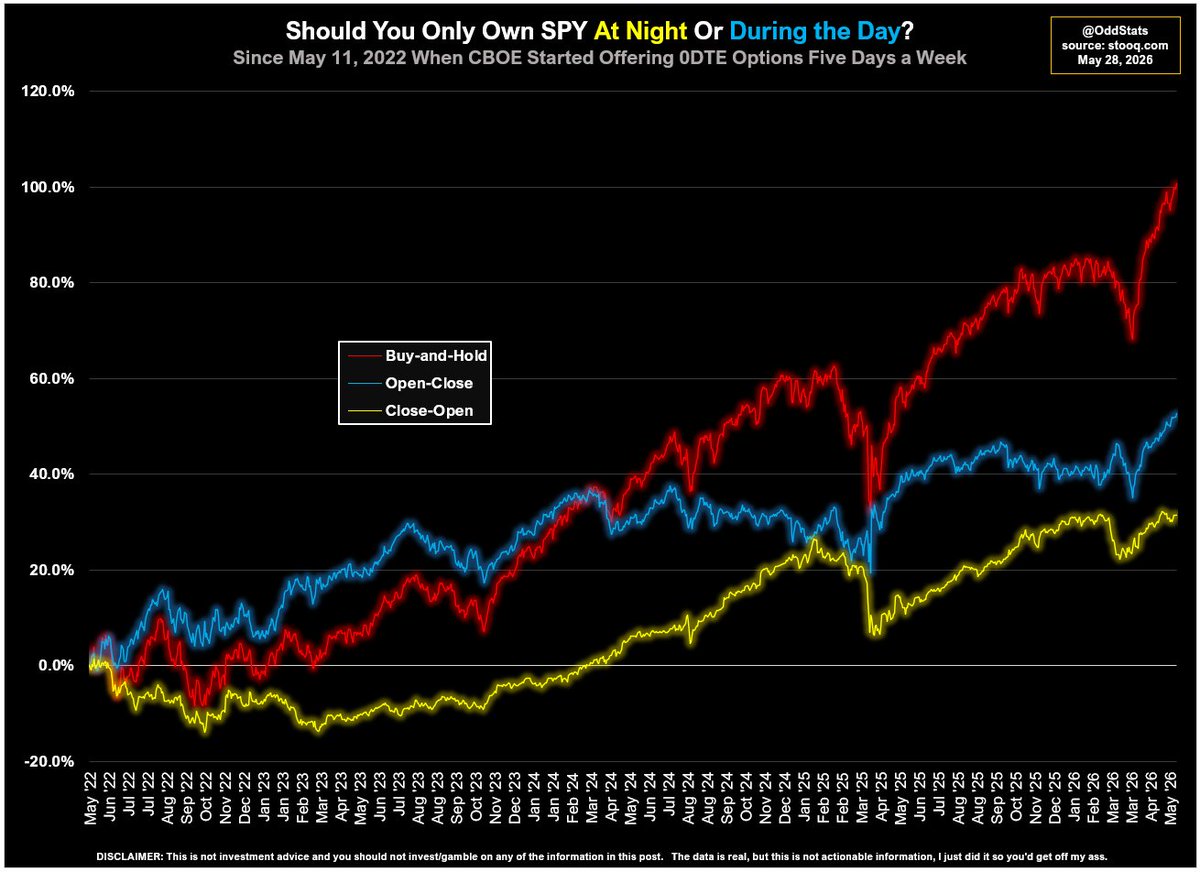
Lexx wants to know how the old
▶ Buy $SPY during the day only or
▶ During the night only
Chart looks since the CBOE introduced 5-day-a-week 0DTEs in May 2022.
So here you go.
EVER WONDER WHAT THE MOST VOLATILE PERIODS OF EACH TRADING DAY ARE, ON AVERAGE?
Me too.
I'm not gonna lie, I think this is one of the coolest things I've ever made here.
This chart shows you how volatile each rolling 30m period is over the course of an average 24 hour trading day. I even tested it out over high VIX and low VIX environments.
Did you think the first 30m of the day were the most volatile? That lunchtime was boring? Check it out.
Huge thanks to the guys over @massive_com for the data to run this. All times on this chart are Central.
The world has spent $7 trillion on wind and solar. That global fleet produces an average of around 630 GW.
The same $7 trillion could have built roughly 1,400 modern nuclear reactors, producing around 1,400 GW on average -- so more than twice the power.
Wind and solar generally last around 20 years (a lot less by some estimates), whereas nuclear plants can operate for 80 years or more.
Over 80 years, wind and solar must be built four times -- a cost of $28 trillion to maintain 630 gigawatts.
The same $28 trillion spent on nuclear would deliver roughly 5,600 gigawatts -- nearly nine times the power.
Also, nuclear produces this regardless of the weather, whereas wind and solar require 24-7 backup (usually gas, not included in these calculations).
It really is worth reading this if you care about reality-based reporting, misinformation etc. Certainly if you want to work as a journalist this is the sort of scepticism with which you should be approaching all surveys, especially campaign-driven ones
I don't label myself The Right, but here's a moral argument: it is immoral to pursue policies that don't work - that will make people poorer and their lives harder - just because they make you feel morally superior.
It is immoral to ignore the evidence you don't like.
It is immoral to pursue fashion over truth and ego over practicality. It is immoral to ruin people's lives (including the lives of the poorest) to satisfy your own moral narcissism.
It is immoral to steal. It is immoral to justify theft on the grounds that a consensus wants to steal.
It is immoral to be an MP and be this abjectly stupid.
We've reached the point where Britain's political debate is dominated by Count Binface.
Meanwhile, the Government has borrowed £274 billion since taking office.
Maybe it's time we spent less time laughing at the circus and more time asking who's paying for it.
Claude is now controlling TradingView live from my terminal.
Switching symbols. Writing Pine Script. Batch scanning futures. Replay trading. Drawing levels.
All autonomous. Zero clicks.
Still has rough edges but the vision is crystal clear.
I told it:
Find me every BTC futures contract with RSI below 30 and volume spike above 200%.
14 seconds later:
→ 6 contracts identified
→ Charts loaded
→ Support levels drawn
→ Pine Script backtests running
→ Entry zones marked
Didn't touch the mouse once.
Then I said:
Replay last week. Show me where your system would have entered.
It switched to replay mode. Scrolled through price action. Marked every edge. Calculated P&L in real-time.
$4,780 theoretical profit from 9 trades.
83% win rate.
Now it writes custom Pine indicators on command:
Build me a momentum oscillator that tracks whale wallet activity correlated with price.
40 seconds. Script deployed. Indicator live on chart.
Most traders are still clicking through 50 charts manually.
Claude scans 200+ in under a minute.
Finds the setups. Draws the levels. Backtests the edge. All while you watch.
This is not about replacing your strategy.
It's about executing it 100x faster.
You only need Claude + laptop + 1 hour/day.
Giving This Free for 24 hours. To get it:
1. Comment the word CLAUDE
2. Like and Retweet this post
3. Follow me @codewithimanshu (so i can DM you)
Save this post. Deploy this setup this weekend. Start testing. Scale on evidence.