I’ve spent the last few days reading lots of comments claiming Salt Lake City’s all-time heat record isn’t legitimate because of the airport weather station.
Today, I talked to the National Weather Service and they responded with data, not opinions.
They reminded me of their 2022 post: https://t.co/uJWsSEL0BL. During peak heating, meteorologists compared the official KSLC ASOS temperature sensor against five independent temperature sensors located just 0.25 mile away in a natural area with dry grasses. Over 20 minutes, the official station averaged 104.6°F. The five comparison sensors averaged 104.3°F. Their conclusion: they found no definitive evidence that the official station is reading artificially high due to calibration or site characteristics.
There are also a few facts that many people don’t seem to know:
The official Salt Lake City climate station has been at the airport since 1928. It has been relocated several times within the airport to meet operational needs, but airport observations have been part of the climate record for nearly a century.
Contrary to one of the most common claims online, the ASOS temperature sensor has never been installed over grass. It has always been mounted approximately 5 feet above the ground, following national ASOS siting standards used across the country.
The temperature sensor isn’t just installed and forgotten. It undergoes routine quality-control checks, typically monthly during the summer, using independent calibrated instruments. The sensor itself was replaced with a newly calibrated unit less than a month ago (June 15, 2026). By policy, it is inspected quarterly and replaced every 18 months.
The ASOS doesn’t simply report one instantaneous reading. It samples the air every 10 seconds, creates 1-minute averages, then reports a rolling 5-minute average for official observations. That process helps reduce random fluctuations.
Now, let’s also acknowledge something equally important:
Urbanization is real. As we replace open land with concrete, asphalt, buildings, and other infrastructure, we increase the local heat storage of the landscape. That’s the urban heat island effect, and it’s supported by decades of peer-reviewed research. The National Weather Service even stated they’ll continue evaluating the site as development around the airport continues.
But that’s a completely different discussion than claiming this weekend’s record was “fake.”
What I find unfortunate is how hyper-focused some people have become on one instrument while losing sight of the bigger picture.
This wasn’t just one weather station.
We were setting or challenging records across much of northern Utah and the Great Basin. Triple-digit temperatures were widespread. The atmosphere responsible for this heat affected an entire region, not a single thermometer.
And yes, we have a handful of “frequent flyers” who seem to appear under every weather post with the same instrumentation theories regardless of what the evidence shows. Healthy skepticism is part of science. But science also requires following the evidence when new data are presented.
The National Weather Service didn’t dismiss the concerns. They tested them, explained how the system works, documented the maintenance history, acknowledged that future development should continue to be monitored, and shared exactly what they found.
That’s how science is supposed to work.
The record heat was real. The data support it. And the bigger story remains exactly what it was all weekend: Utah experienced one of the most extraordinary heat events in its recorded history. #utwx
Big congratulations to @Cat__McClure, PhD! 👏🔬👩🏼🎓
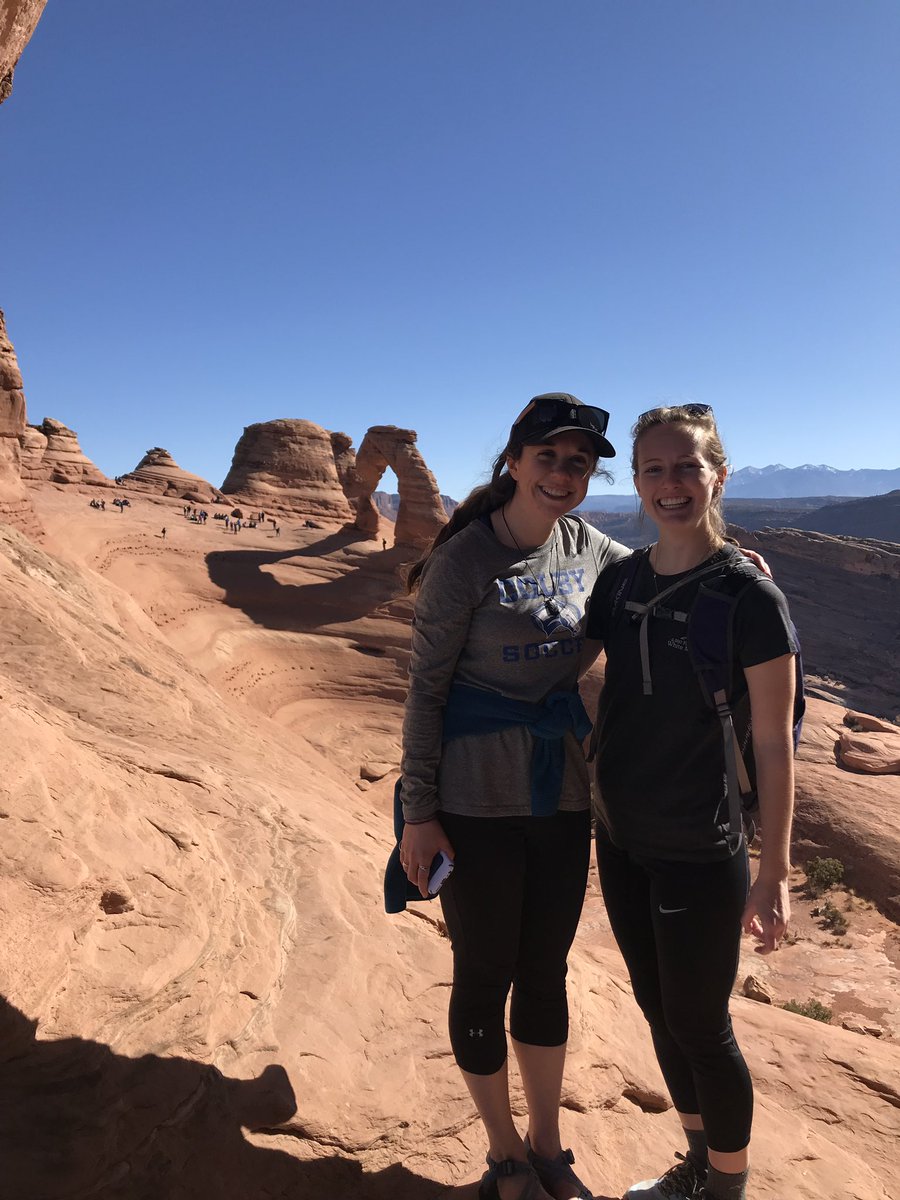
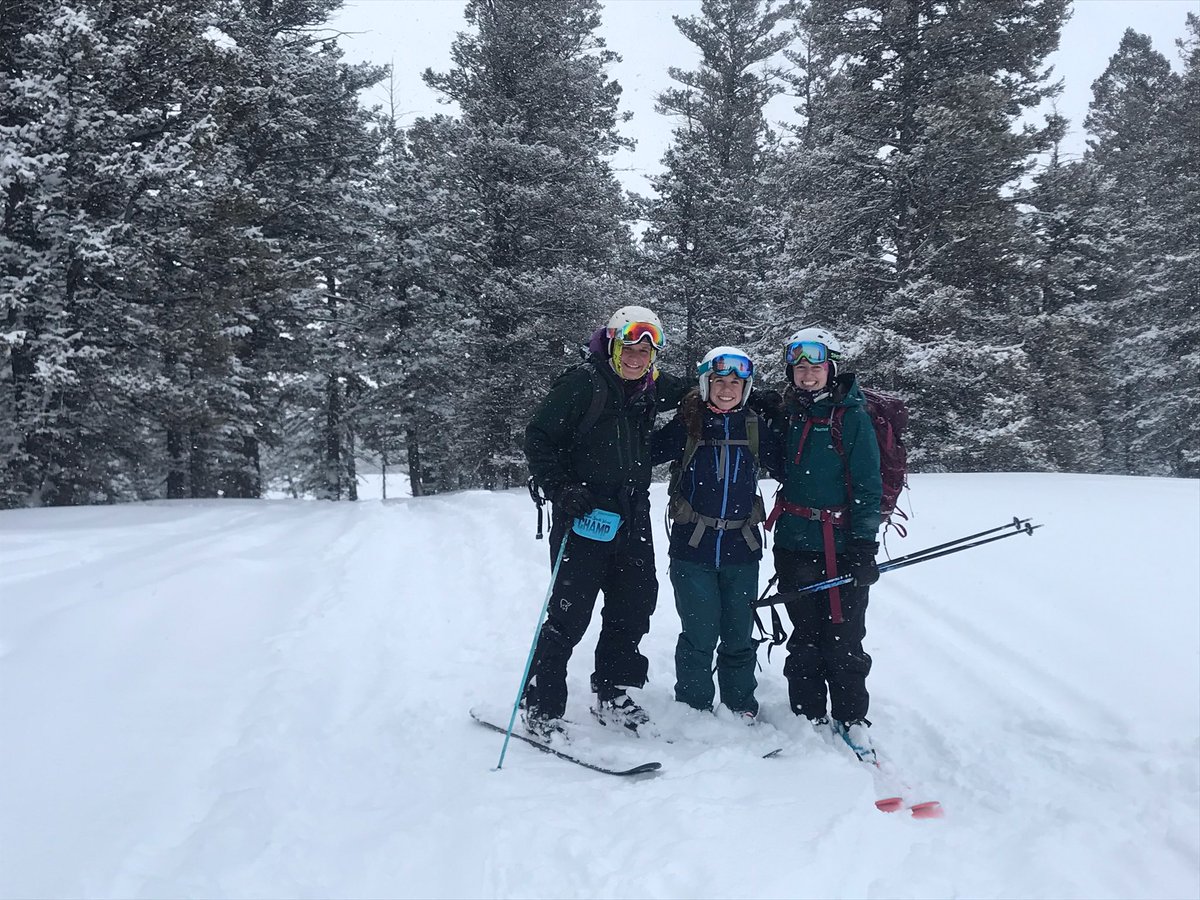
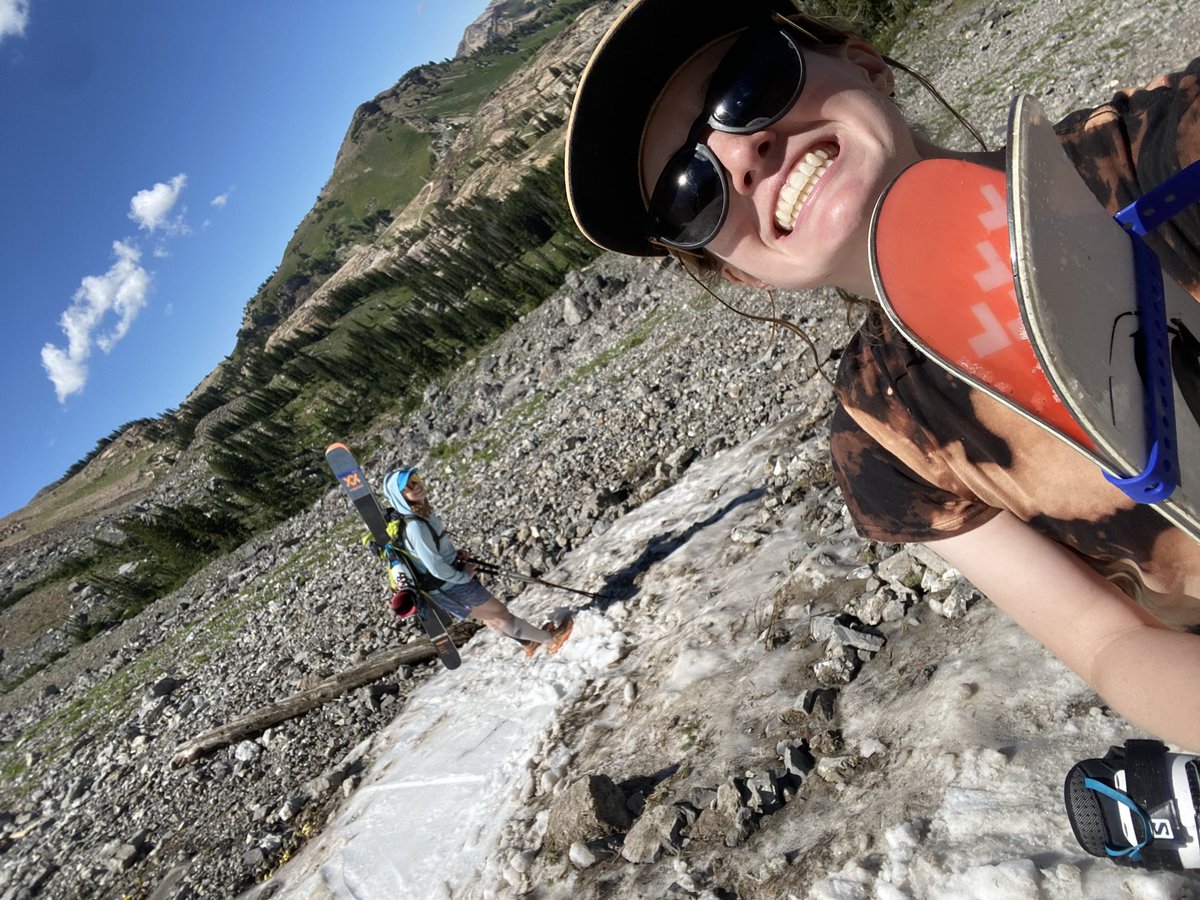
So proud of everything you’ve accomplished these past few years, and thankful for all the fun times in Utah along the way! 🏜️⛷️💕
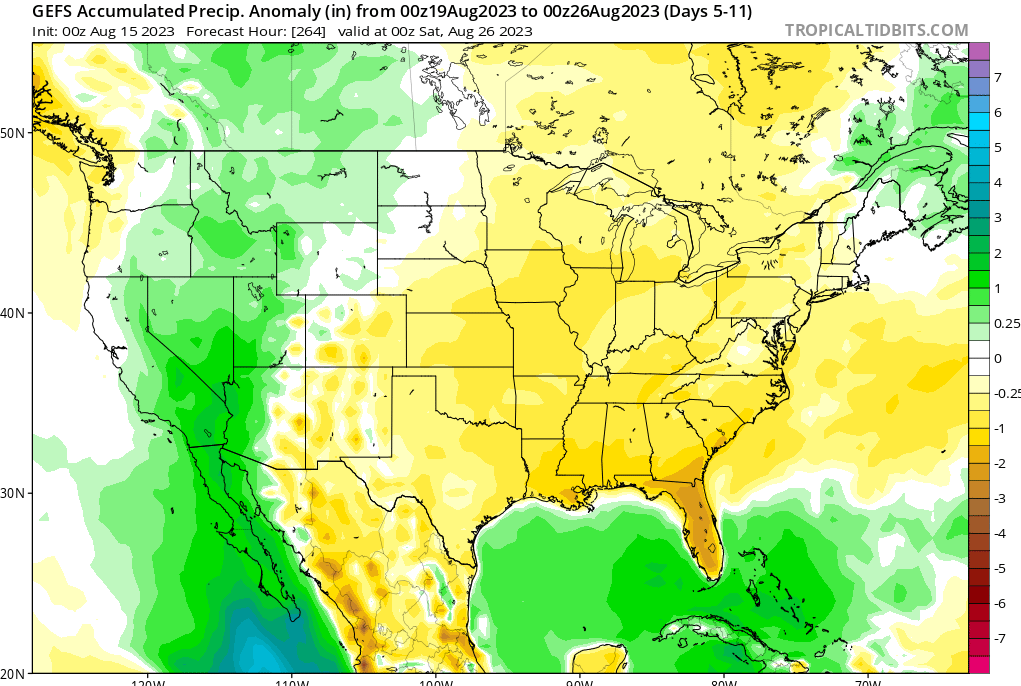
Confidence growing in a push of tropical monsoon moisture for the Desert Southwest. Timing will be late this week into early next week.
I'll keep you updated. #utwx ☀️⛈️
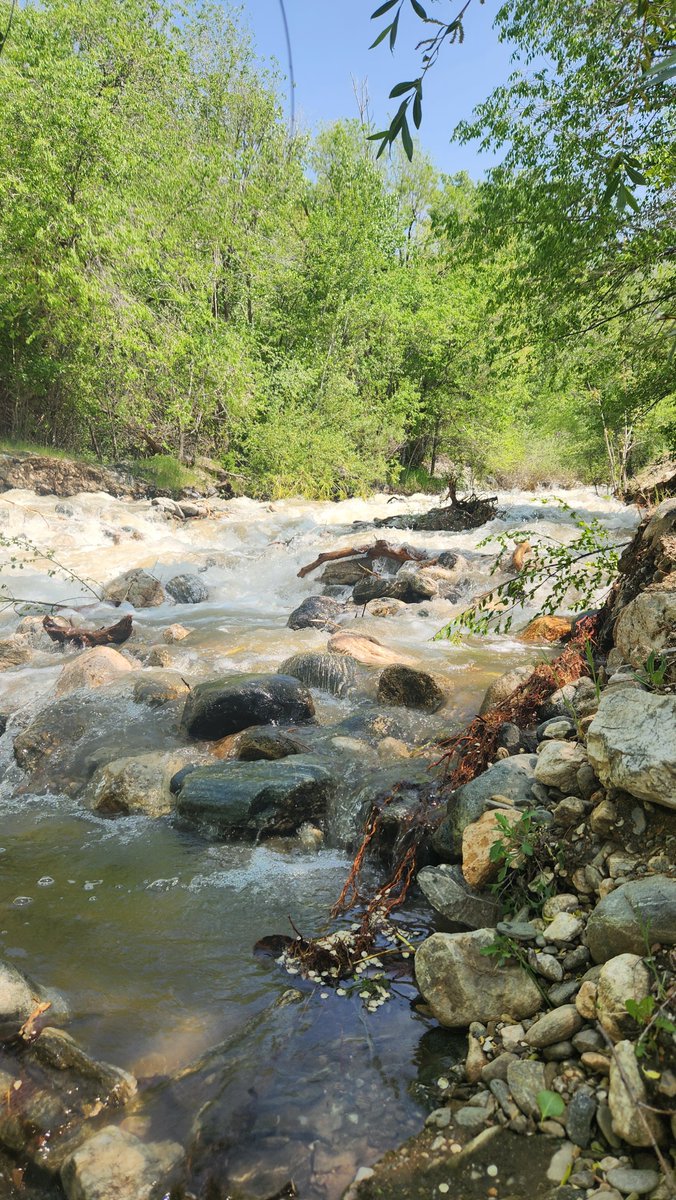
Current pov: Snowmelt cascading into #FarmingtonPond.😍This pond was created as a debris basin (90 years ago!) to help prevent flooding downstream. Grateful for bright minds who create water systems like this that help protect infrastructure & communities. #KnowYourH2O
What a difference a year makes! The photo on the left shows MODIS imagery from the NASA Terra satellite from this date one year ago while the photo on the right shows the same imagery from today. #utwx
It’s been a historic week at Snowbird as we flew by our all-time snowfall record and then eclipsed 800” for the season. So far this storm has delivered an additional 18” overnight bringing the storm total to 67”—over 5 feet of snow.
The upcoming winter storm is predicted to cause a massive #seiche in #LakeErie, with a water level difference of nearly 20 ft (6 m) between #Toledo & #Buffalo! A seiche is a large standing wave oscillating in a body of water. Follow this 🧵 for more! https://t.co/LCiuHAhnxv