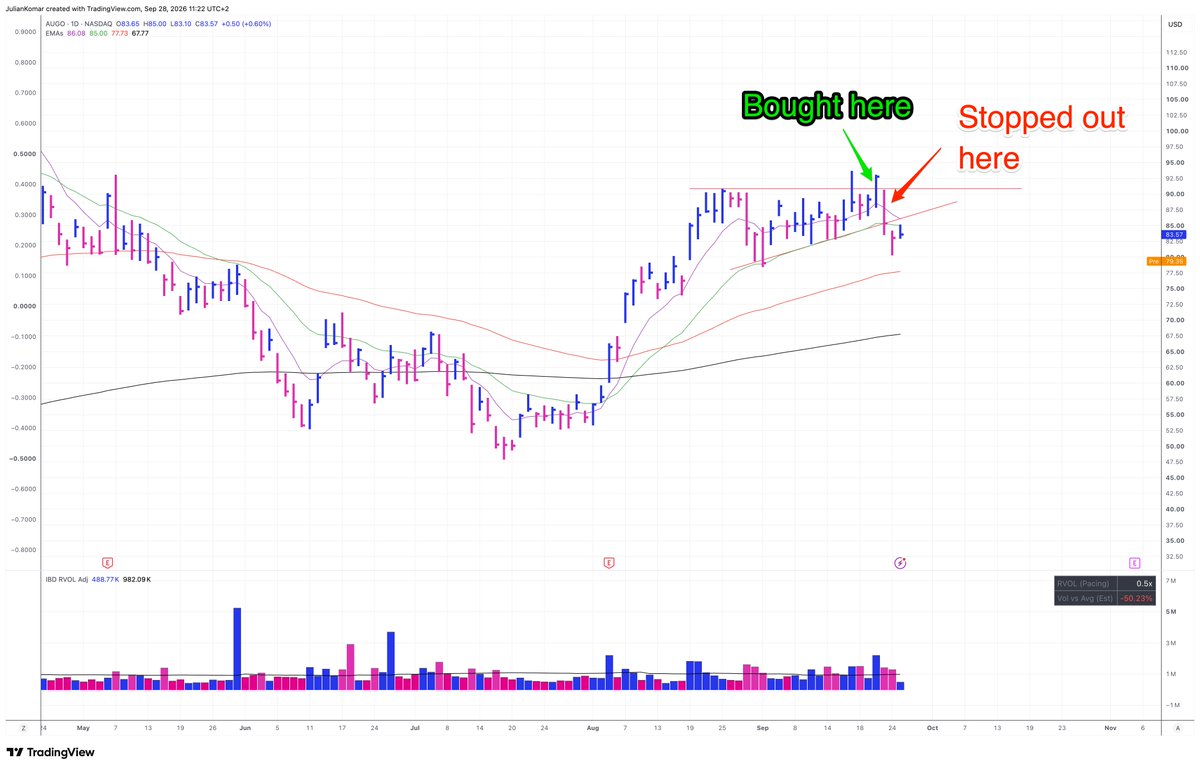
These are the setups of the best traders I’ve interviewed:
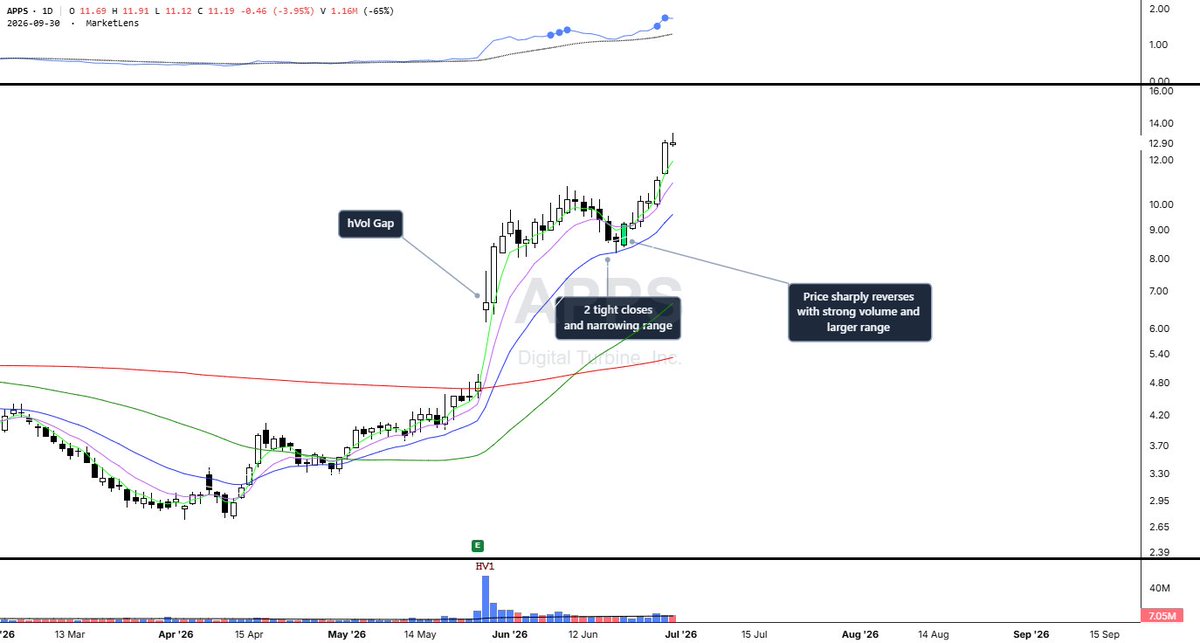
Catalyst Gaps
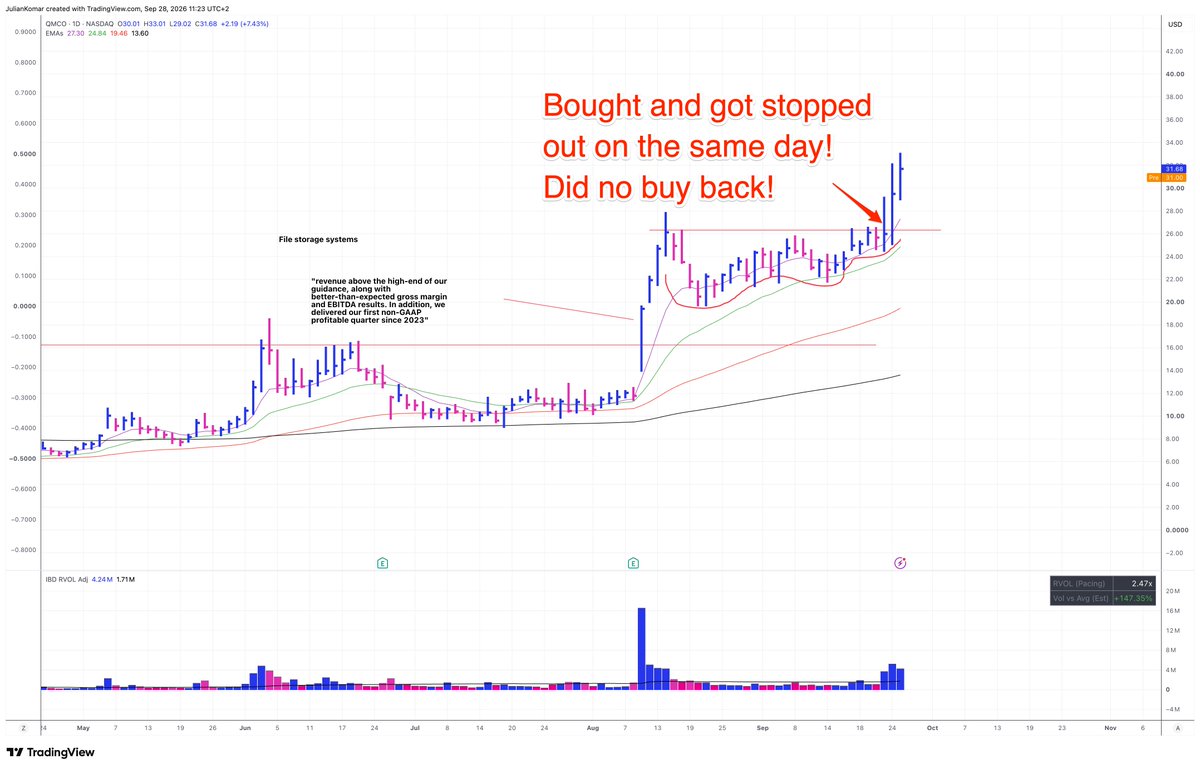
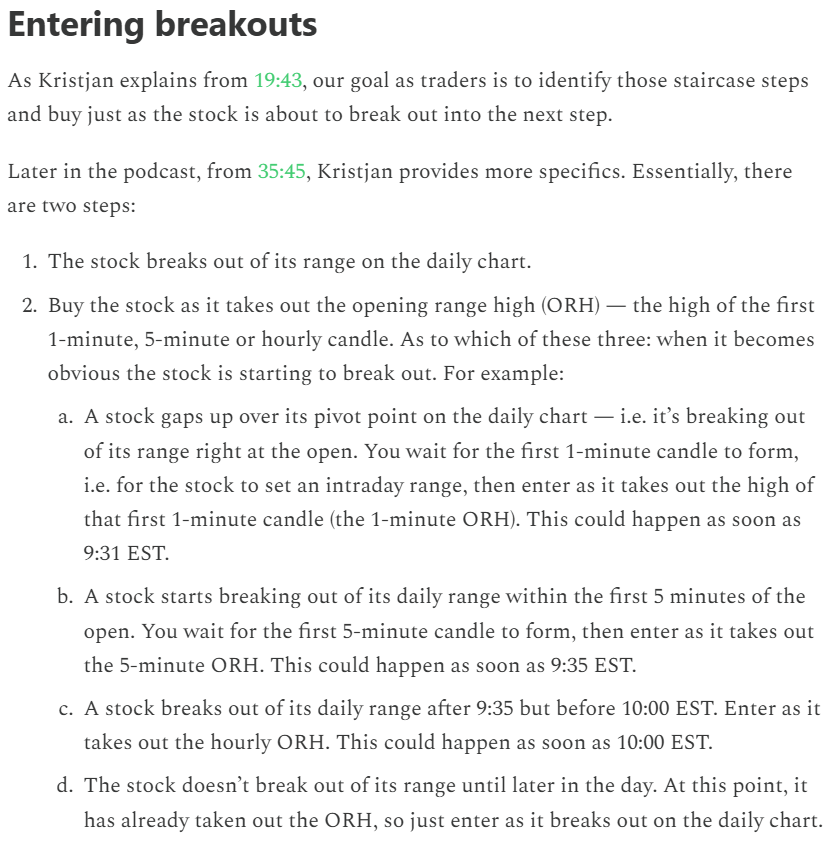
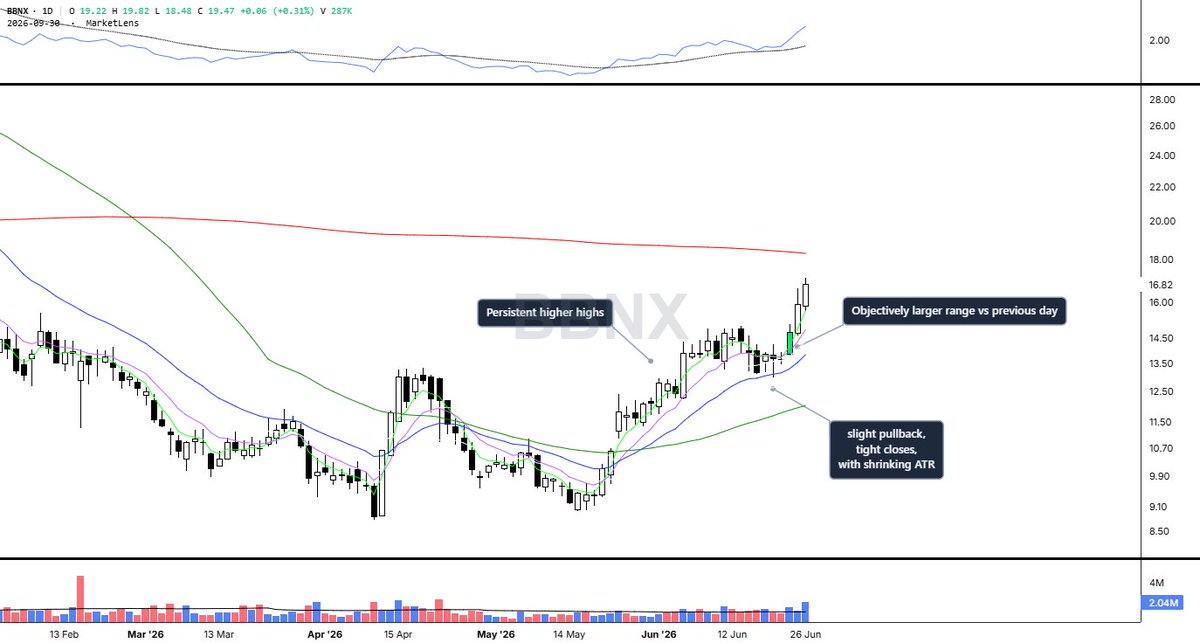
Base Breakouts
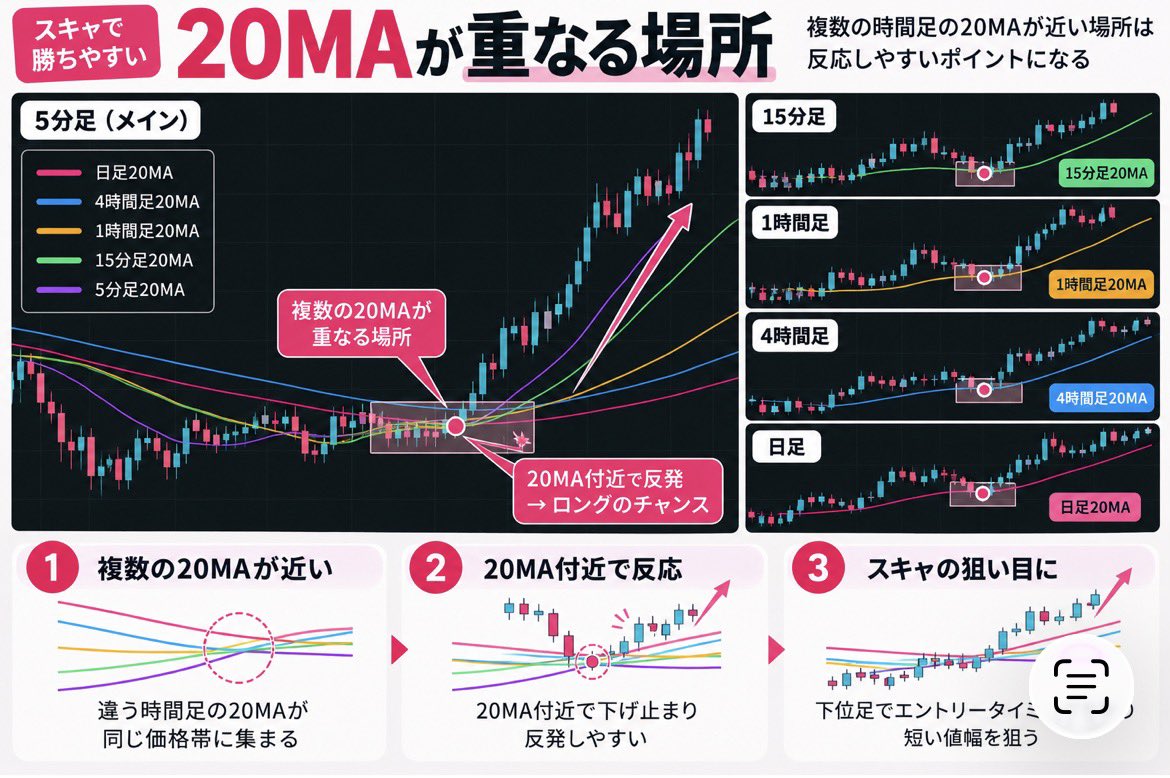
Mean Reversion Long
Mean Reversion Short
Pullback/Undercut & Rally
They allow you to manage risk versus a key level/turning point where you can expect significant expansion from your entry
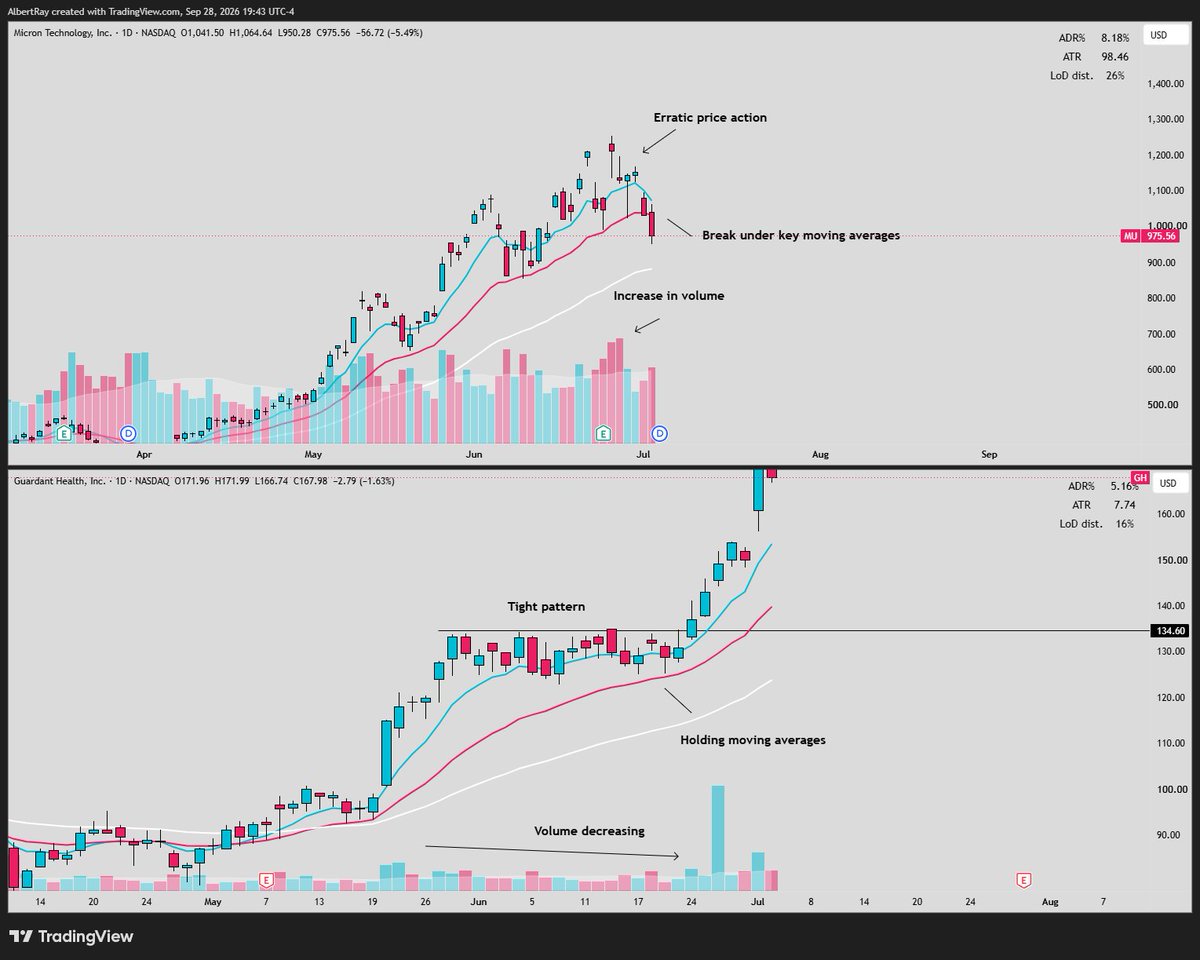
How do you tell the difference between a healthy pullback and the beginning of a reversal?
Pay attention to HOW price is pulling back....
A healthy pullback should be boring:
Price slowly and methodically drifts lower into key moving averages while volume continues to decline.
There’s no urgency from sellers
No aggressive downside candles
No major increase in volume
The stock is simply digesting the previous move and allowing the moving averages to catch back up to price
A reversal looks completely different:
-Price action becomes wild and aggressive.
-Downside candles start expanding
-Volume INCREASES as the stock sells off
-Key moving averages and previous support levels begin getting broken with force
That’s telling you selling pressure is increasing rather than drying up
This is why I always analyze price AND volume together....
Slow pullback + declining volume = constructive
Aggressive selling + increasing volume = warning sign
Don’t just look at the fact that a stock is pulling back
Pay attention to HOW it’s pulling back
The structure will more likely than not tell you exactly everything you need to know
You don’t need to invent a single original concept to become a great trader.
@OliverKell_ taught me the cycle of price action, 15min pivots + “the trend is your friend.” @1ChartMaster taught me the 30min pivot. @LanesWRLD_ taught me effort vs. result. @ShakePryzby1 taught me layers of probability + timeframe continuity. @RealSimpleAriel taught me to focus on leading groups + cut my weeds.
And there are probably 100+ other traders on here I’ve stolen little nuggets from over the years. The important part is I tested everything, kept what fit my personality, and slowly molded those pieces into MY system.
You don’t need to reinvent the wheel to become a great trader. Learn from people ahead of you, verify it yourself, then make it yours!!
You do not need to become the next ICT furu.
At 26 years old, Chris Creamer made 100% in a single month and won the World Trading Championship.
He just revealed the exact strategy he used, step by step, for the first time ever 👇
Seneca cured anxiety 2,000 years before therapy existed.
He was the richest man in Rome and advisor to an emperor. And yet he spent his life writing about how to calm the mind.
If your mind keeps turning tomorrow into an emergency, read this: ↓
Someone today asked me for an overview of @Qullamaggie’s strategy.
…which is a great reminder that it’s been 3 years since I did that kind of writing.
I covered breakouts here: https://t.co/c7OjDoZ6GI
And EPs here: https://t.co/VRTUibN3jQ
(Don’t judge the writing. I had much to learn.)
But I can’t stress enough that you cannot just blindly copy someone else’s strategy and expect the same results. The environment isn’t the same.
More importantly, *you* are not *them*.
Your success depends on ingredients that revolve around YOU — because this business takes hard work and acceptance of suboptimal decision-making.
Trading means taking risk. And that’s uncomfortable. Particularly because, by design, the markets show you just how money you left on the table.
So, how much discomfort can you stomach? What kind can you stomach?
Not going through the hard work of idea clarity + refinement, along with a good amount of introspection, is a recipe for failure. Because you’ll be unable to stick with your (uncomfortable) approach.
Develop an approach that brings out your strengths, mitigates your weaknesses, and generally just works for your personality, goals and lifestyle.
You’re not Qullamaggie.
But you’re you.
And no one can beat you at being you.
Everything I do is explained in this book.
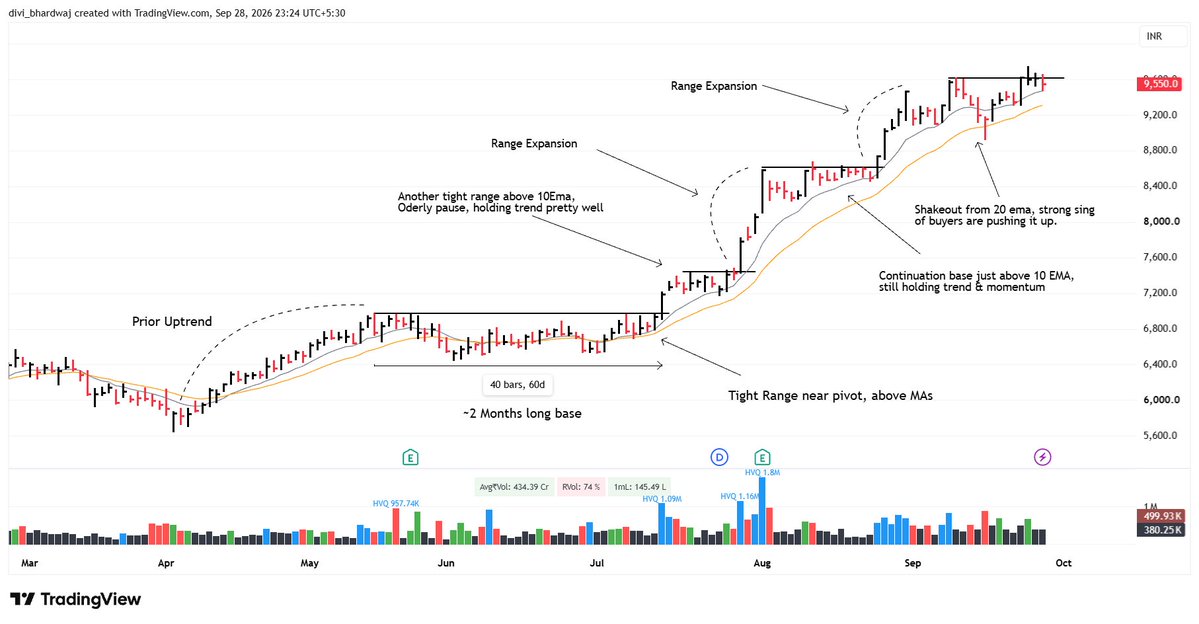
The real distinction between the way I trade vs other "breakout traders" is I am not lookking for 'breakout pattern' to form.
Instead, I focus on stocks that have a pause in momentum, then resumes higher.
This has many different looks
Catch & Ride a Winner.
The goal isn't to catch every breakout.
It's to identify a strong stock, enter at the right moment, and have the patience to ride the trend.
Look for:
➜ Prior uptrend
➜ Long base/accumulation
➜ Tight range near breakout
➜ Breakout with strong volume
But the real game starts after the breakout.
Watch for strong follow-through, price holding above the breakout, and healthy volume.
Then be patient.
A strong stock may repeatedly hold the 10 EMA, contract in range, and then expand again.
Contraction → Expansion → Contraction → Expansion
As long as the trend remains intact, let the stock work.
Find strength. Catch the move. Manage risk. Ride the trend.
The big money often comes from the winners you had the patience not to sell too early.
Here's the truth:
You can't change your last 20 trades.
But you can improve your next 100.
Whenever I get frustrated with my trading, I try to use that frustration as a trigger to improve.
It usually means I've gotten off track somewhere.
That happened to me again over the last few weeks.
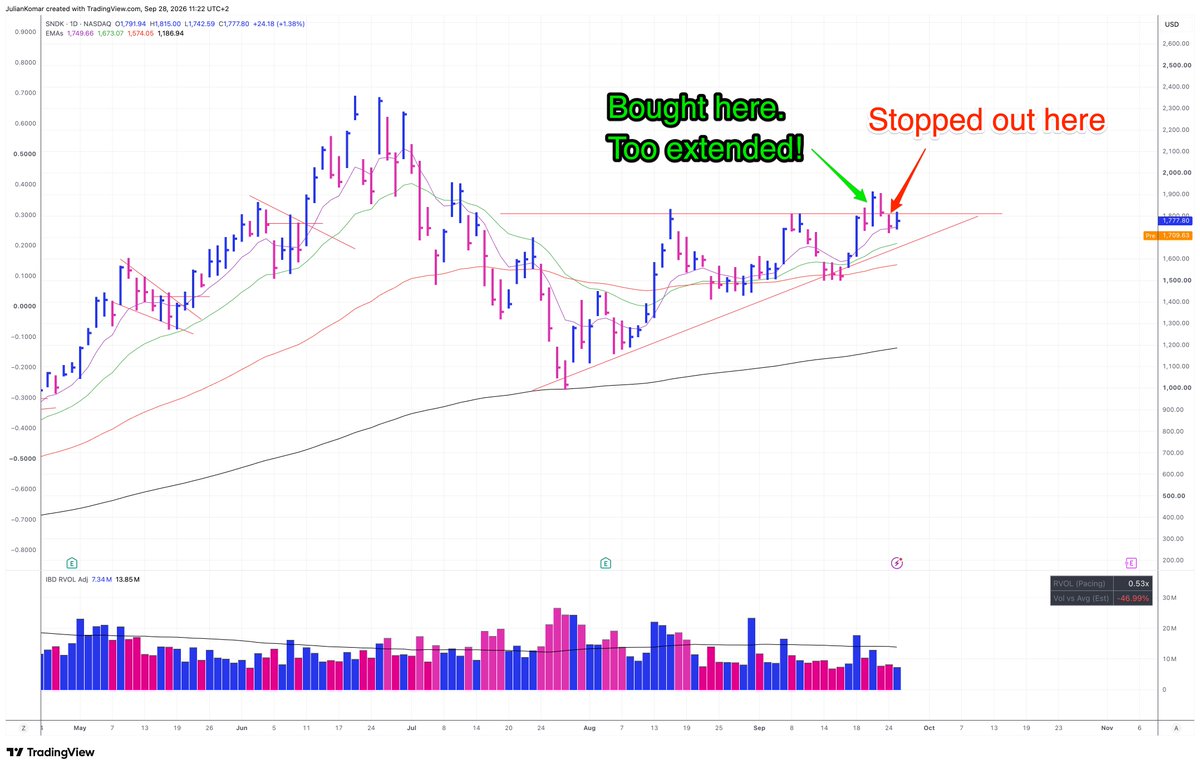
The market was difficult and going sideways. I tried to get into the leaders, but looking back at my trades, I could see that I had become too loose with my entries.
Some stocks were too extended.
Some bases weren't tight enough.
I wasn't necessarily breaking my rules. But my standards had slipped.
So I did what I always do when I feel I'm getting off track:
1. Reduce my trading frequency.
2. Review my recent trades.
3. Compare the winners with the losers.
4. Look especially at setup and entry quality.
5. Identify the 1-2 problems that keep repeating.
6. Review my journal and mental preparation.
7. Turn those findings into a focus for my daily routine.
For me, "refocusing" also means spending more time with my chart books, setups and rules.
I want to remind myself what has actually made me money in the past instead of trying harder to make something work now.
That's something I also recommend to traders I coach:
Don't waste a difficult period just being frustrated about what happened.
You can't undo those trades.
Study them.
Find where you got off track.
Then use what you learned to make your next 100 trades better.
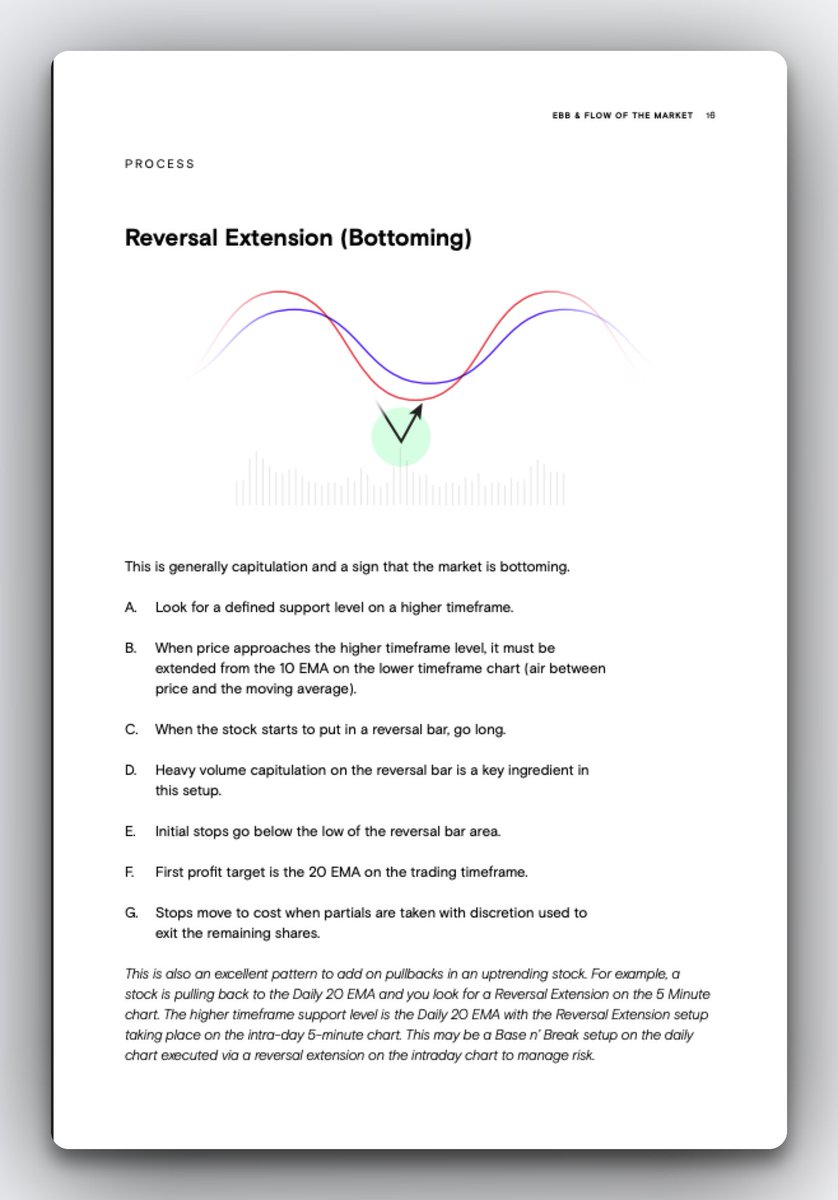
Step one of Oliver Kell's Cycle of Price Action: the Reversal Extension.
Price reaches a support level on a higher timeframe while stretched far below the 10 EMA. A reversal bar prints on heavy volume, and that's the entry. Stop goes below the low of the reversal bar, and the first target is the 20 EMA.
Victory in Stock Trading by @OliverKell_
"You can cry all right, but you can't quit."
In his final interview, 99-year-old Charlie Munger spoke about losses that cannot be undone. His nine-year-old son, Teddy, had died of leukemia.
"I cried all the time when my first child died."
Munger said you cannot bring back the dead or fix every tragedy. If you have to walk through the streets crying for hours, you can keep going that way.
He called it "soldiering through." His words offer reassurance when you're struggling: crying doesn't mean you've given up.
Decades later, he described the pleasure it had given him to watch doctors learn to save children with leukemia. He couldn't bring Teddy back, but he could feel joy for families who now had a chance.
His words are in the two-minute clip below.
The only way to make big strides in your trading performance is via a quantifiable adjustment of your statistical trading behavior.
It's perfectly normal to experience losing weeks, months, or even quarters. The key is to remember that trading is a long-term endeavor. The 'holy grail' everyone seeks begins with shifting focus from just solely studying charts to also analyzing your trading statistics. This is the only way to identify and fine-tune your issues on a law of large number perspective.
Your good and bad trading behavior can't escape your journal if you are diligent with this process. Some things you can start identifying;
1. That 1-3 days duration (MoM) that you are 'hyper' actively executing new position, what is the spot of the market index? what was the previous 10 days trend at breadth level? Are the outcome desirable? If not, that's a major area you could fixed immediately.
2. Track your longest consecutive losing streaks every month. My average is around 11 to 13 (yes 13 straight losses, it's normal for me). There was a standout recent month in 2023 where the number was 25 (That's +200% more than my usual proficiency), and I was able to correct the issue immediately the following month (back down to 11) from such end of month review. What the journal told me was my losing streak largely stern from 13 new trades in 3 days when $SPY was already extended from 10 and 20-MA spot, which all got stopped out within a 2 days period from a minor pullback. That 'chasing' behavior was largely because I just came out of a losing month when most are profitable (i knew because my ranking dropped out of top 10 in USIC period while those within my placing +gain% in performance).
3. Work on reducing your average R loss, and track the progress MoM. You need to accept that outcome of a trade cannot be controlled, but you can absolutely control your risk. A reduced average R loss is another method to push your up your monthly profit factor. If you size your risk via R-concept approach, the conventional understanding is stop loss is equivalent to 1R loss. Be creative, you can reduce this number easily via scaling down size in unprofitable trades even before it hit the eventual stop. In my experience, my best trade are often the ones that never re-visit your entry-stop range, it will just go and give your a tidy profit by day #1 market close.
4. Track the progress of your monthly Profit Factor (I use R factor so Avg R Gain / Avg R Loss). Improvement stern from this number. Don't be satisfied with catching 1 big winning trade, that is not trading proficiency. If I were to hire, I will hire someone not making money but with PF improvement for 6 consecutive months. It is just a matter of time he becomes a money printing machine.
5. Your monthly Max R loss (maximum $ loss also). Go study it and find out the reason why you lose more than you expected. It is a good reminder not to let such behavior repeat again because these are potential account blow up behavior. My max R loss was -8.4 in a single trade 7 years ago. It was an execution prior to earnings with a perfect setup that seemingly meant for a gap up, I was wrong but i never allow myself to be in that spot again. My last 5 years max R loss is only at -2.45 on an unannounced earnings guidance (warning), unavoidable.
Breaking down and studying your trading journal is really necessary. If you are not doing the above 5, which imho are the most impactful to your performance and proficiency growth as a trader, you can only blame yourself if you don't make it.
🚫 La ciudad de Japón que visitas DELATA tu clase social:
🥉 Clase baja
· 🇯🇵 Osaka (Dotonbori comiendo takoyaki)
· 🇯🇵 Nara (excursión exprés a ver ciervos)
· 🇯🇵 Tokio (dormido en habitación compartida)
· 🇯🇵 Kamakura (el viaje que entra en el pase)
🥈 Clase media ↓↓
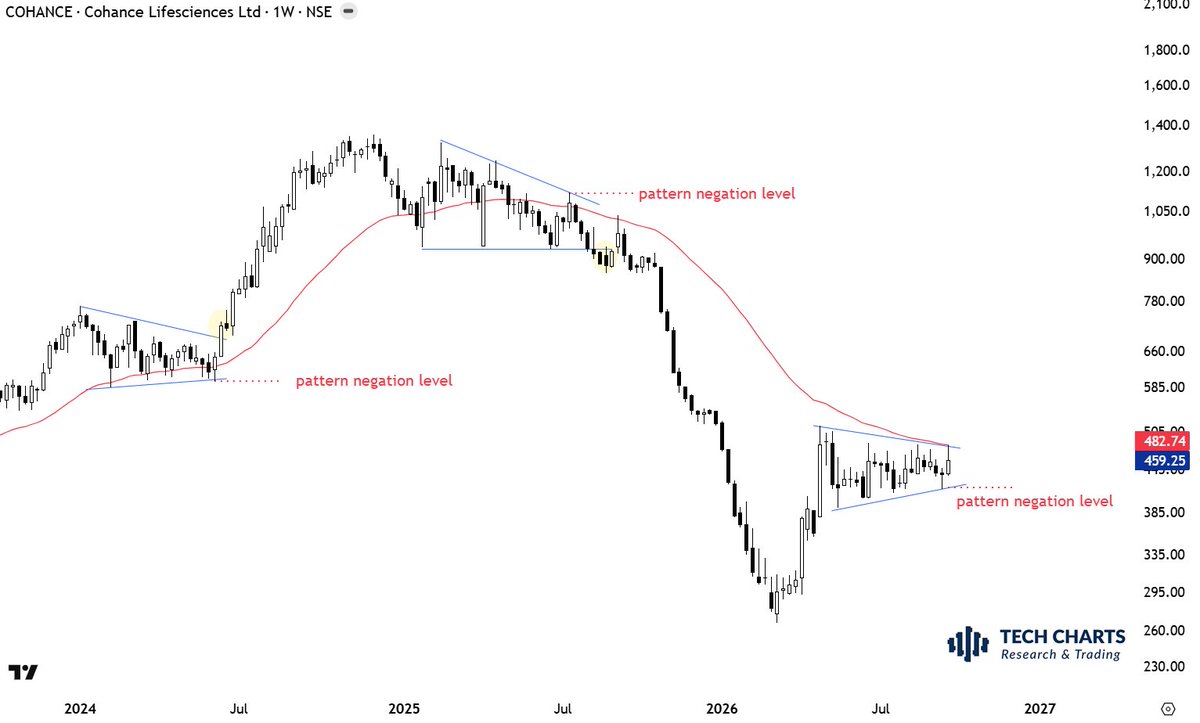
200 day EMA (on daily), 40 week EMA (on weekly) is my trend filter.
I use trend filter with classical chart pattern breakouts and breakdowns. Interested in only long signals that take place above the long-term average and short signals that take place below the average.
In this case I am monitoring this symmetrical triangle for a long signal that can take place above the year-long average.
5/15/30min ORBs, 6/20s, 15/30min pivots + VWAP reclaims off major daily/weekly pivots... that’s basically my entire entry playbook.
Backtest each, figure out which ones actually fit your personality & beat them to death. You don’t need 10+ entry models. Keep it stupid simple.