$BTC is sitting around $58-59k and the structure remains bearish.
Trading below every major moving average.
RSI around 30, approaching oversold.
June closed down ~19%, despite historically being one of BTC's strongest months.
The bigger story is ETF flows.
Spot Bitcoin ETFs posted roughly $4B in net outflows during June, the largest monthly outflow on record. That's institutional money leaving the market, not retail panic.
Capital also appears to be rotating into semiconductors. Bitcoin ETFs saw roughly $12B in outflows, while semiconductor ETFs attracted around $20B.
Key levels:
$55,298 = critical 0.5 Fib support.
Lose that, and $52k/$48k come into focus, with a measured move pointing toward ~$42k.
Bulls need to reclaim the 20D EMA at $62,450, followed by $64k resistance.
If $58k breaks, $55k is likely next. Above $62.5k is where the technical structure finally starts to improve.
Key test for stocks next week. Currently showing a failed Daily cycle that was not negated with a new high. This range will be telling. New highs is blow off continuation vs below June 9th I think the summer is very weak.
How this can be made from a 6hr transcript in 5min will never stop impressing me! Yes, it will be better in the future because there are few small errors. But overall it's mostly accurate! Cannot wait to see what the future holds with the power of AI!
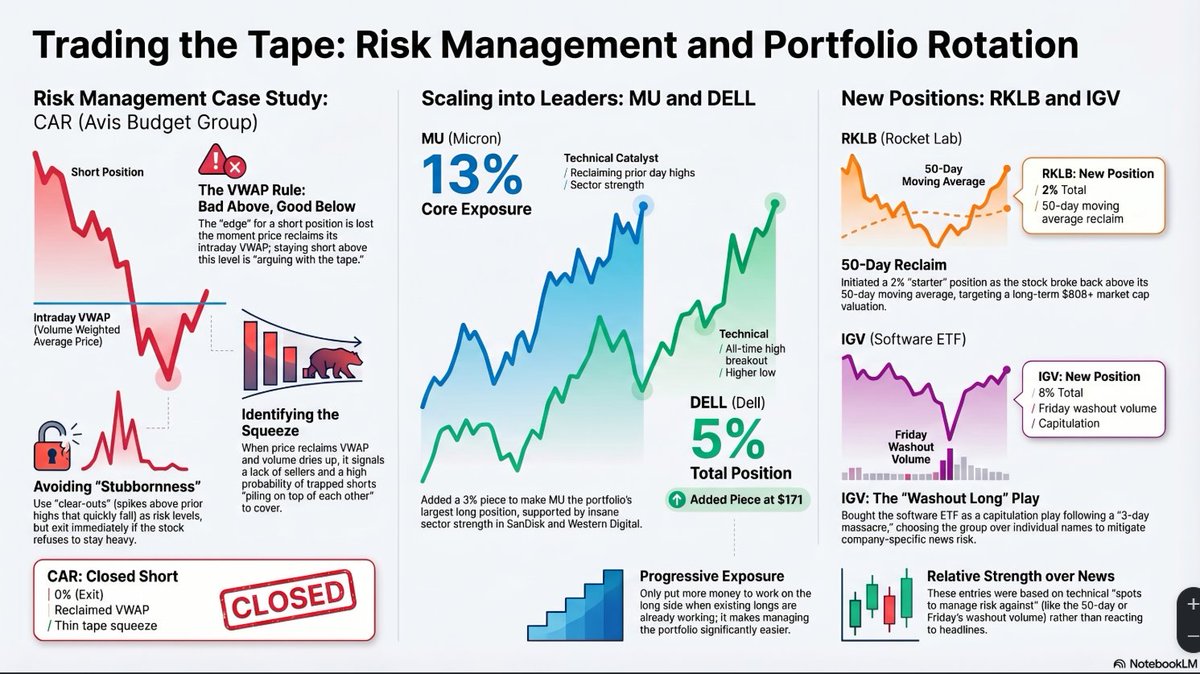
- $RKLB my belief is $80B market cap.
- $MU is now 15% exposure.
- $DELL added piece at 182.29 with a now $171 avg.
Otherwise incredibly accurate!
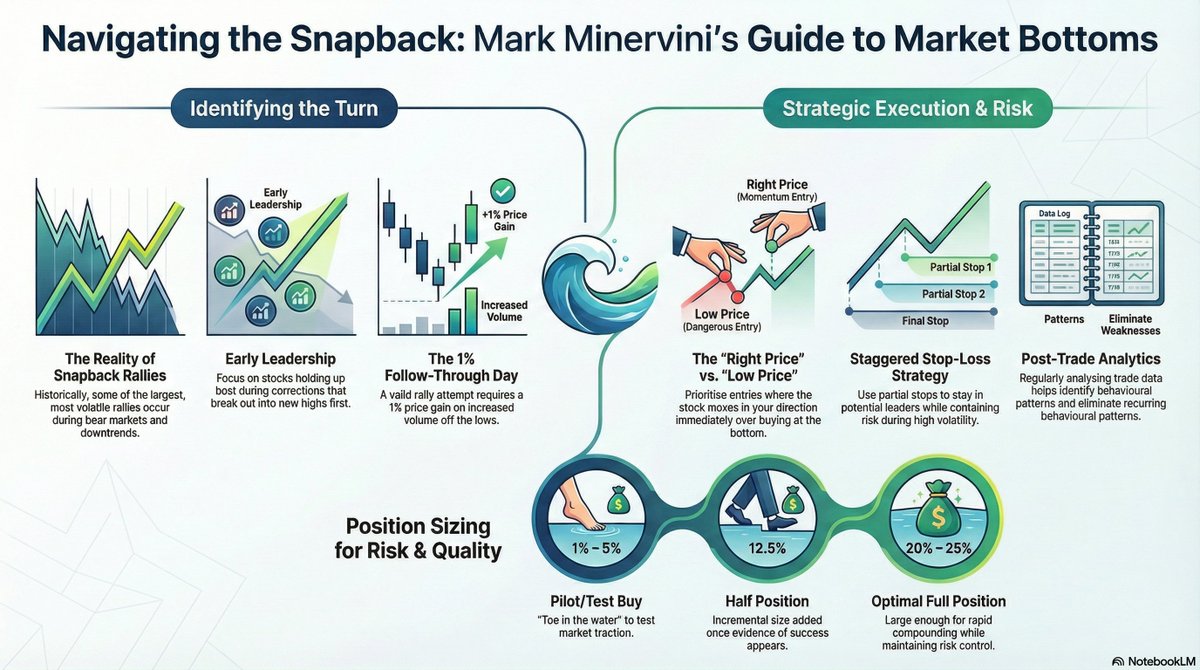
Today’s market strength was textbook. This is exactly what markets do during corrections when they get stretched to oversold levels. As I said just recently, "some of the biggest rallies occur during bear markets and corrections." Today was a perfect example.
Traders rushed in after headlines hit that Iran’s president signaled a willingness to end the conflict with the U.S. The Dow exploded higher by 1,125 points. But let’s not confuse cause and effect. The news may have been the trigger, but the market was already set up for a rally. It was oversold and primed. Now comes the part where discipline matters.
We ignore the first few days of a rally attempt. That’s potential noise. What matters is whether the market can follow through and whether leadership begins to emerge and proper setups develop.
Technically, this is a classic snapback: Indexes that broke below the 200-day are rallying back toward it, while Indexes that held the 200-day are bouncing off it. That’s typical countertrend behavior until proven otherwise.
Expect volatility to remain elevated. That’s not where low-risk money is made, but it's certainly where the risk is. Your job during corrections is simple: identify the stocks showing the best relative strength and the tightest price action. Those are your future leaders when the market finally turns.
On the macro side, nothing has been resolved. Higher crude prices are still a problem. Yesterday’s rally did nothing to materially bring down oil. The bigger issue is still in play and the jury still out. Oil at these levels feeds inflation, pressures growth, and gives the Fed a reason to stay on hold longer. Yields stay elevated in that environment.
To cut through all the noise, I look to the market itself, which has a much better track record of telling us the truth than the politicians, the analysts, the news, and the gurus.
The four steps of the bottoming process are:
1. Oversold – The difference between an ordinary pullback and an oversold condition starts with price, but it does not end there. Poor breadth and and a lack of volume confirmed follow through describe a one-sided market, and one not to trust.
2. Rally – Inevitably, the market bounces from its oversold condition. A high-quality rally is broad-based. A low-quality rally is defined by short covering and driven primarily by the stocks that have declined the most. Again, the character of the rally is important to distinguish. So far, we simply don't have enough data to make a confident determination, so patience is the watch word while we wait.
3. Retest – After the rally, there is almost always a retest. The popular averages approach, and in some cases breach, their oversold lows. The key to a successful retest is less selling pressure, such as fewer stocks below their moving averages, fewer stocks, sectors, and markets making new lows, less total volume, and less downside volume. If the retest fails, the process reverts and we generally start looking for divergences during lower lows. In the event of unexpected news, it is possible for the market to recover in a "V" fashion with no retest. In that case, we look at breadth confirmation and participation.
4. Breadth thrusts – In the final phase, not only do benchmark indices rally sharply with few pullbacks, but they do so with an extremely high percentage of stocks, sectors, and markets participating, or what technical analysts call breadth thrusts. In rare cases, the market has skipped step 3. With strong enough breadth, retests are not necessary. The Covid bottom is an example of a pretty powerful V-shaped recovery.
Bottom line:
This was an oversold rally, sparked by headlines—but not defined by them, and certainly not confirmation of a reliable bottom.
Now we watch:
--Quality of follow-through
--Emergence of leadership
--Market internals and model health
If the rally lacks quality, if economic pressure builds, or if leading stocks begin to deteriorate, then this remains what it likely is—a rally within a correction.
Stay objective. Let the market prove itself. If you are going to trade, do so incrementally.
https://t.co/JXzFFTmMtn
Back to the market. Oil is surging, volatility is expanding, and sentiment is quickly turning bearish—that’s your first clue. When fear spreads wildly, you have to start thinking contrary. But let’s be clear: Powell has signaled he’s on hold until there’s clarity out of the Middle East. That means uncertainty remains the dominant force—for now.
After last week’s meeting, Fed Chair Jerome Powell emphasized that further evidence of easing inflation is required before additional policy easing is considered: “If we don’t see that progress, then you won’t see the rate cut.”
Market expectations have shifted. In just a week, bond traders moved from anticipating rate cuts to pricing in roughly a 50.0 percent probability of a rate hike by October. In Europe, markets are now pricing in as many as three ECB rate hikes by year-end.
Recession risk is rising as the Iran conflict prolongs and oil prices are elevated. A slowing U.S. economy could hurt corporate profits and also exacerbate emerging stresses in the private credit market.
At some point, we’re going to get a sharp snapback rally. That’s inevitable. But don’t confuse a reflex rally with a new uptrend. Some of the most powerful rallies happen inside bear markets and major corrections—they trap the impatient and reward them with whipsaw action.
The market is news driven. If this conflict resolves quickly and favorably, we could see a classic V-shaped recovery. If not, the market is going to likely need time to repair to establish a durable bottom.
Oil will eventually present a good shorting opportunity. Equities will bottom. But timing is everything—and for the low-risk trader, volatility is the enemy.
That's why I’m never concerned with buying at the lowest price—I want the right price. I want alpha, and I want it fast and efficient.
Grinding for pennies in chaotic conditions is for gamblers and action jumkies. Those are hard-penny environments—and that’s where amateurs get chopped up.
Professionals have what I call sit-out power—the discipline to wait for easy-dollar conditions, when the odds are clearly in your favor. How long do they wait? As long as it takes. That's where the discipline comes in.
https://t.co/JXzFFTmMtn
Starting to get bearish at the wrong times is very costly, even in a bear market. Like in the 2022 bear market:
1/24 - 2/2: +10.8%
2/24 - 2/28: +10%
3/14 - 3/29: +17.1%
5/20 - 6/2: +12.3%
6/16 - 8/15 +23.9%
And these are only the rallies who's lower were eventually taken out.
2008 GFC Crash:
▫️ S&P 500 dumped 20%, then pumped 14% before another 53% drop.
2020 Covid Crash:
▫️ $SPX dumped 15%, then pumped 9% before another 30% drop.
2025 Tariffs Crash:
▫️ SPX dumped 10%, then pumped 5% before another 16% drop.
2026 Dump:
▫️ SPX has dropped 9% and could drop a bit more.
After that a relief rally will happen, followed by another leg down.
Trading frequency - a commentary from a five decade veteran
I follow about 40 global futures markets
I enter each year figuring that I might three good signals in a given market over the course of 12 months -- maybe four. That's it. For a given market there will only be three or four price bars that I will consider suitable for taking a risk position. If I trade a market more than five times in a year I consider that I over-traded -- that my nose was too close to the chart. Then it is time to be conscious about pulling back from daily charts and re-focusing on weekly charts. As a rule, if I cannot see a pattern on weekly chart then it is 80% certain there is no trade for me.
That's it -- three or four price bars that are important. The rest are noise.
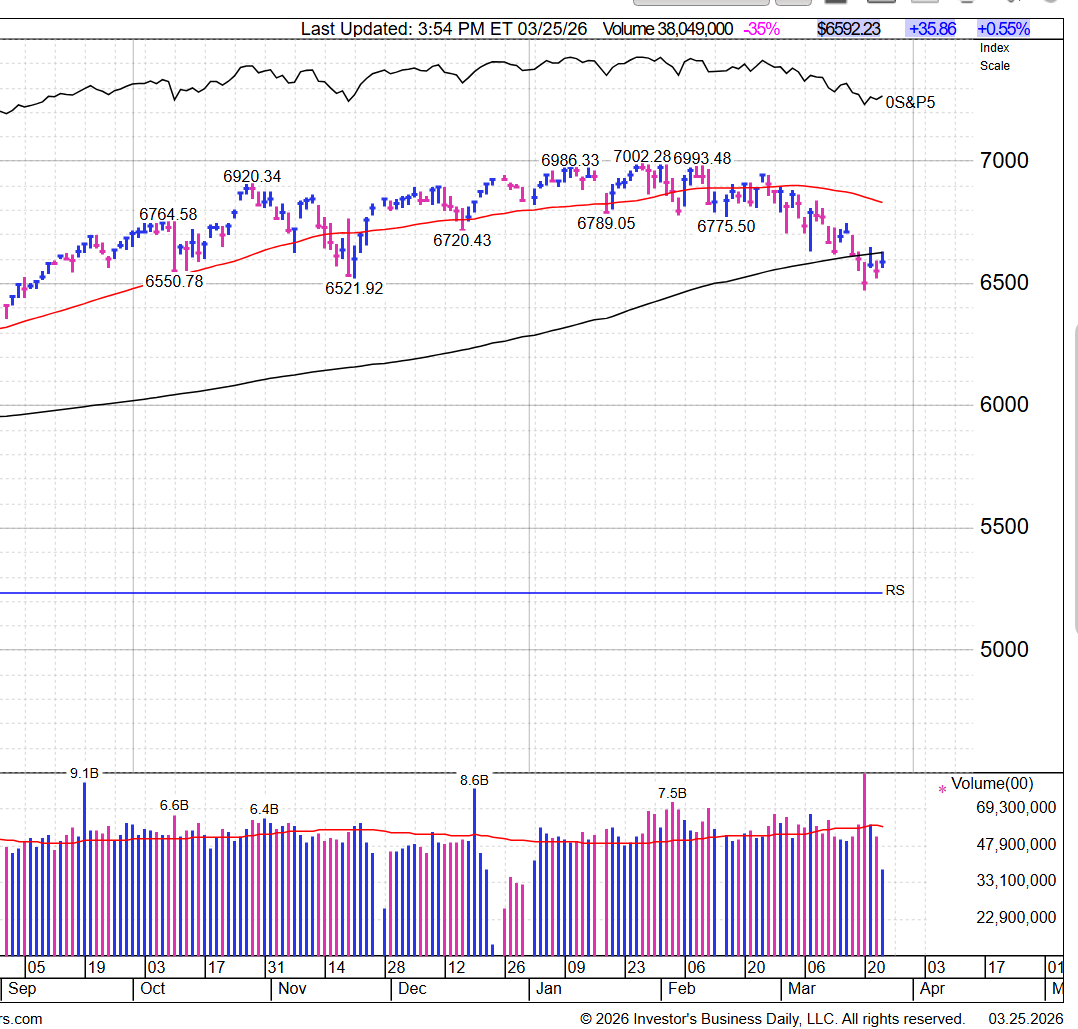
The market's character is still one of a bear market or cyclical correction; strong open, fade into close and major average living below the 200-day line. Before a reliable bottom can be established, we need to see better price and volume action, including better action from breakout names forming bases.
We are clearly NOT out of the woods yet. The market backdrop is one where sentiment has improved with rising pessimism, but not a full capitulation. The VIX has reached bear warning levels, but remains below true washout extremes. A volatility washout is not required for a bottom, but would add conviction.
Bullish Scenario
--The war ends
--Oil prices recede
--Stagflation concerns ease
--Central banks continuing their easing trajectory
Under this scenario, we would expect:
-A broadening market advance
-Emergence of new leadership from sound bases
-A Follow-Through Day (FTD) on the NYSE and/or NASDAQ confirming institutional buying with little in the way of immediate distribution
-Significant drop in volatility
Bearish Scenario
--The war persists or escalates
--The Strait of Hormuz remains disrupted
--Oil prices make new highs
--Stagflation becomes evident in hard economic data
This would likely result in:
-Limited general market rally attempts with most breakout stocks failing
-Lack of follow-through from breakout names
-Further deterioration in breadth and leadership
-Dearth of setups in buyable position
-Continued elevated volatility and distribution
In that case, sentiment would likely need to reach higher levels of pessimism before a durable market bottom could form. In its absence, and end to the factors that are pressuring the market could cause the market to bottom in less dramatic fashion.
Action within individual leading themes is far more impressive than what we are seeing with $SPY $QQQ.
Here is the clear and obvious reason why. Names that can carry these markets higher are themselves struggling to make meaningful progress for months.
SPY top holdings by weight:
$NVDA 7.68% hugging the 200sma
$AAPL 6.53% and 1% above the 200sma
$MSFT 5.16% and below the 200sma
$AMZN 3.64% and below the 200sma
$GOOGL 3.14% and below the 50sma
$AVGO 2.64% below the 200sma
$GOOG 2.50% below the 50sma
$META 2.36 below the 200sma
$BRK.A 1.57% below the 200sma
That's 35.22% of the ETF struggling to move higher within the SPY
QQQ top holdings by weight:
$NVDA 8.67%
$AAPL 7.37%
$MSFT 5.82%
$AMZN 4.51%
$TSLA 3.91% below the 200sma
$META 3.59%
$GOOGL 3.55%
$WMT 3.31% below the 50sma
$GOOG 3.28%
$AVGO 2.98%
That is 47% of the ETF struggling to move higher within the QQQ.
If we get too distracted by what the ETFs are doing we lose sight of all the the strength that IS working its way higher
I'm not trying to minimize the difficulty of this environment but we need to have a good understanding of what is really holding things back.
I believe there is a good chance that Stocks have peaked for its 4 Year Cycle. Last week my 'active' portfolios went into more defensive positions, cash to 33%. Further selling to come on more confirmation.
Seeing the signs of the breakdown on the Daily Cycle currently. The weekly Cycle has NOT yet confirmed this, so it's early days on this view.
A top would bring the Oct timeframe into focus for a bottom. Given the AI capex and fiscal stimulus, this more likely to be a relatively mild cyclical bear, a shakeout, setting up for a really explosive rally for 2027-2029.
Summary - Weekend Minervini On The Market Report - March 6, 2026
The major indexes are clearly under pressure now. While some of the indicators we track—such as up/down volume—remain neutral, the tape has been distribution-dominant for several weeks, something I’ve been pointing out in recent updates.
Previously, that distribution was somewhat fragmented between the NYSE and the NASDAQ. Now the weakness has become more synchronized. The Middle East conflict has clearly accelerated that deterioration, and participation among individual stocks has turned negative.
We’re seeing what I refer to as “pivot leakage”—increased volatility on the right side of bases near buy points. When that happens, the market becomes much more difficult to trade effectively. For the moment, stepping aside and remaining patient is the prudent approach.
Sentiment: Improving, But Not at Contrarian Levels Yet
Investor’s Intelligence advisor sentiment has improved slightly from a contrarian perspective, meaning bullishness has come down. However, bears have not meaningfully increased. In other words, we’re seeing less bullishness, but not real pessimism yet.
The bulls-to-bears ratio remains elevated—still well above 4-to-1. Historically, more pessimism is needed before durable bottoms form.
If the market continues to hover here or declines further over the coming weeks, we should begin to see more bearish sentiment emerge, which would actually be constructive for the market.
Long Term Advisor Models and Market Signals
Our SPY Advisor Model has not yet changed or raised cash. That model is intentionally designed to filter out short-term noise and respond primarily to longer-term price action.
If the market continues to deteriorate, the model will automatically begin raising cash and could eventually move to a sell signal—but that process requires either more time or further downside.
Bear Market Markers: No Major Crisis Yet
When evaluating whether we’re seeing a cyclical correction or something more severe, we monitor a set of bear market markers, including macroeconomic and geopolitical factors.
Right now, there is no evidence of a structural bear market environment similar to:
--The 2000–2003 bear market
--The 2008 financial crisis
The one notable development has been the surge in oil prices, driven largely by geopolitical tensions.
Oil moving above $80 per barrel is important. Historically, that level acts as a tipping point where energy prices begin to negatively impact economic growth.
If oil were to continue climbing toward $90, $100, or higher, the negative effects on the economy would likely accelerate. However, if the current surge proves to be a temporary geopolitical shock, it may only result in a short-term correction rather than a major bear market.
Financial conditions remain healthy:
--Credit quality remains strong
--Interest rates are stable
--The banking system is in good shape
So at this stage, there is no systemic financial stress.
Index Technicals - NASDAQ
The NASDAQ has now pulled back to its 200-day moving average. This move makes sense considering the deterioration we’ve been seeing in breadth and the topping action in several mega-cap leaders.
In longer-term bull markets, it’s common to see multiple pullbacks to the 200-day moving average before the trend resumes. However, it’s important not to buy simply because the index reaches that level. We need to see how price behaves around it.
Dow Jones
The Dow also experienced a significant decline last week, bringing it close to its 200-day moving average.
Small and Mid Caps
The S&P 400 mid-cap index had a tough week but remains in a broader uptrend. Even if it pulls back toward the rising 200-day moving average, the overall structure remains constructive.
The Russell 2000 shows a similar pattern.
Despite recent underperformance, I still believe small and mid-cap stocks offer opportunity as capital continues to rotate away from the mega-cap leaders.
Leadership Deterioration
The IBD 50 index is showing signs of technical deterioration.
After breaking out from a base earlier, the index is now rolling over as volatility expands on the right side of many patterns. The relative strength line has also turned down.
This suggests the market will likely need time to repair—possibly several weeks or longer depending on how geopolitical developments unfold.
Volatility Spike
Volatility has risen sharply. The VIX moved above 28.5, which we consider a bear market warning level. While this doesn’t automatically signal a bear market, it does require close monitoring.
Periods of elevated volatility often coincide with market bottoms, but they can also mark the early stages of deeper corrections.
Breadth Deterioration
Another indicator we monitor is the percentage of stocks under pressure.
Currently, 78% of stocks are under pressure, which signals widespread deterioration across the market.
This reading can appear near market bottoms, but it can also occur at the start of more serious corrections. What matters now is whether the damage begins to spread further through base failures.
Right now, the market resembles a sprained ankle. If more bases begin to fail, it could evolve into something more serious.
STEM Model Warning
The Stock Trading Environment Model (STEM) turned red on February 4, indicating deteriorating conditions.
This shift should not come as a surprise—market internals have been weakening for some time.
We’re now seeing former leaders breaking down. For example:
--Bloom Energy came under heavy selling pressure on Friday.
Several technical violations occurred, including Stage 2 breakdown signals.
This is part of the reason the percentage of stocks under pressure has surged.
Former Leaders Rolling Over
Several major leaders now appear to be entering Stage 3 topping patterns.
Palantir
Palantir looks increasingly toppy. While it may eventually form a new base, the stock has broken below its 200-day moving average and rallied back toward it—often a location where short setups emerge.
Historically, many former leaders decline up to 70% after secular tops. That doesn’t necessarily mean Palantir has topped permanently, but it reinforces the need for patience.
Nvidia
Nvidia also appears to be transitioning into Stage 3 behavior. The powerful relative strength that characterized its leadership phase has faded.
Money has rotated aggressively away from these mega-cap leaders.
Market Cycles
Cycle analysis still suggests strength through May, followed by seasonal weakness during the summer months and into early fall.
If the geopolitical situation stabilizes quickly, the market could recover sharply in a V-shaped rebound.
However, a longer period of volatility might actually be healthier, allowing sentiment to reset and excess speculation to wash out.
Trading Environment
Right now:
--Setups are scarce
--Volatility is elevated
--Breakouts are unreliable
Even strong setups are likely to whipsaw traders in this environment.
When conditions look like this, the best strategy is simple:
--Cash is king.
--Patience and capital preservation are paramount until conditions improve.
What I’m Watching Next
For a healthier market environment, I want to see:
--Sentiment become more pessimistic
--Traders become skeptical of new setups
--Quality bases begin forming again
Interestingly, over 90% of major stock market winners begin their moves when sentiment is extremely negative and traders distrust the setups. We’re not there yet. But that’s what we’ll be watching for.
Final Thoughts
The market is under pressure, but there is no clear evidence of a structural bear market yet.
--Be patient
--Protect capital
--Wait for the next wave of proper setups
When volatility rises and the tape deteriorates, the smartest move is often to do nothing at all.
https://t.co/JXzFFTmMtn
$ETH has broken above the $3,300 level.
Ethereum just needs to reclaim the $3,450 level, and the rally towards the $4,000 level could happen quickly.
If ETH gets rejected from the $3,450 resistance zone, the entire rally could get retraced.
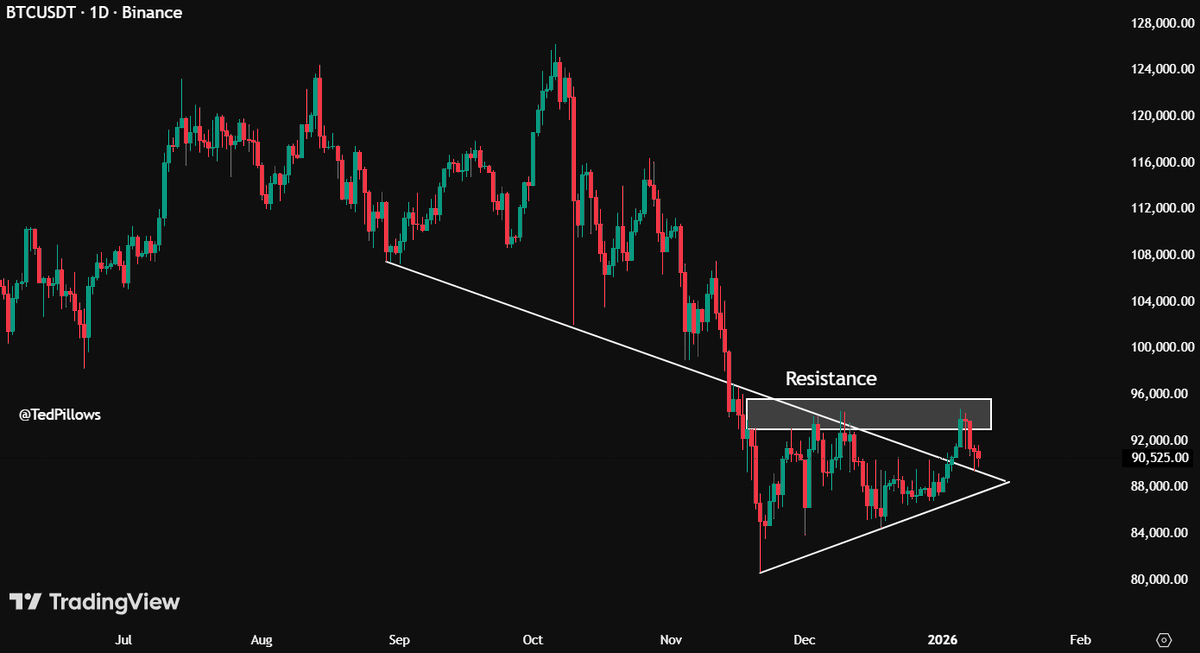
These are the 3 key levels for $BTC now.
The first one is the $89,200 level, which has acted as a support.
If this is lost, Bitcoin will drop towards the $87,500 level.
Losing the $87,500 level on the daily means a new low will happen.
On the upside, BTC needs to reclaim the $94,000-$95,000 level.
A daily close above this will most likely push BTC towards the $102,000-$103,000 level.
Key range for Bitcoin remains unresolved. Rejected and likely 60-day cycle high.
But maybe is enough upside action to suggest it's part of a general counter-trend rally underway.
That said, think this is classic bear market behavior. Esp considering equities at ATH's