My $NIO thesis, pinned so I can be held to it:
Long since 2021, averaged down along the way. I post with a deliberately bearish lens, because most of X reads data with zero context.
Example: “Tesla’s declining too.” Sure — with a stale lineup and a couple of refreshes. NIO stayed FLAT while launching ES9, L80, an L60 refresh and the ES8 5-seater. Same headline, opposite disease. Context is everything.
The bear case (mine to beat):
• Stuck at 35-40k/month since Oct 2025
• Holding that level required a launch treadmill
• Q2 guide missed at the low end — WITH three launches in the quarter
• $XPEV and $LI ran this cycle first: ramp → plateau → de-rate
The bull case (what keeps me long):
• Mix shifting premium — NIO brand now ~56% of volume
• Margins rising through a price war, back-to-back non-GAAP operating profits
• Neither XPEV nor LI plateaued while margins improved
Verdict comes this fall: hard comps start now. 40k+ in Oct/Nov with margins intact → turnaround is real. Anything less → the market was right.
Challenge everything above. That’s why I’m here.
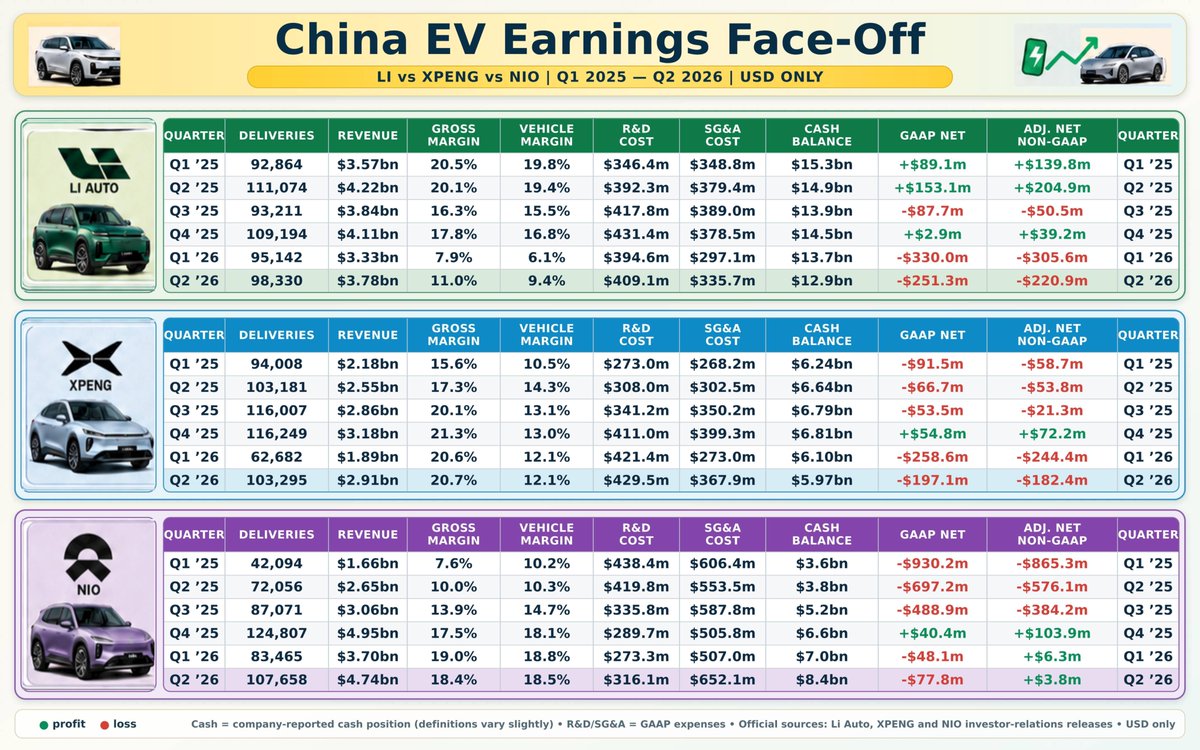
$NIO Q2’26 looks exactly like $LI Q1’25: vehicle margin 18.5% vs 19.8%, adj. net barely positive, deliveries at peak. Five quarters later Li’s margin was 9.4%.
The real problem is Onvo. A mass-market car that still melts. L80 is a flop. Q3 guide 108–111k is a plateau, and mgmt’s Q4 target of 40k/month = 120k is -4% vs Q4’25 (124.8k).
YTD +58% → Q4 flat. That’s Li Auto’s playbook, and the market is already pricing it. $XPEV
Tomorrow: August $NIO deliveries. Last Aug was 31.3k. Hold the current ~36k run-rate and YoY goes from +71% to +15%. Not a red flag, just math — the baseline gets tougher every month from here (Oct '25 was 40k, Dec 48k). As a shareholder I care less about this one print and more about the guidance. That tells us the trend.
This is the right move – and honestly how NIO should have operated from the get-go. One roof, shared staff, and every NIO walk-in gets eyes on ONVO and Firefly. Better late than never: the Sky Store rollout started in Jiangmen in Feb, targeting ~210 cities. I’ve been asking what turns the order curve around without a new launch – distribution efficiency like this is one of the few real candidates. Worth watching whether the rollout pace picks up. $NIO
Guangzhou just got its first store bringing NIO, ONVO, and firefly all under one roof, and we dropped by to check it out.
Putting all three into a single space makes a lot of sense: they share the showroom floor, sales staff, and service team in the back. It cuts down running costs for individual shops, and anyone walking in for a NIO naturally gets eyes on ONVO and firefly too.
$NIO #ChinaEV #ONVO #firefly
It’s in the table you posted. The 2025 columns on the left: $NIO W31-25 = 36.0k, W32-25 = 30.0k – the L90 pre-order weeks. This year: 8.4k and 8.5k. That’s -77% and -72% YoY, and the table’s own YoY row prints exactly those figures. WoW being flat (-1.6%) is true but a different metric – nobody claimed a WoW collapse. The YoY point stands: last year’s launch spikes are now the comps, in orders already, in deliveries next.
$NIO weekly orders YoY: -79% (W31), -72% (W32).
And before anyone says ‘that’s just a launch comp artifact’ – yes. Exactly. Last year’s comparison weeks are the L90 pre-order surge: 36k and 30k orders per week. That artifact is the whole point, because the same one hits Q4 deliveries next: ES8 + L90 drove roughly half of last year’s record 124.8k quarter. Orders show the YoY flip first. Deliveries follow with a lag.
Meanwhile the monthly order trend: May 86k → Jun 77k → Jul 44k → Aug running at ~35k pace. Halved from the launch peak – through the heaviest launch cadence in company history (ES9, L80, 5-seat ES8, updated L90/L60). And July orders (44k) barely exceeded July deliveries (35.9k), which means the backlog isn’t building anymore. It’s draining.
What this table shows in orders in August is what the delivery numbers look like in Q4. The market prices that in advance – and that’s why the stock trades where it trades, record H1 or not.
Just to be clear: I’m long $NIO and underwater. I’d love to be wrong. But the data is the data.
This is a genuinely useful model – appreciate you laying it out. It also makes the two load-bearing assumptions visible: (1) weekly orders re-accelerating 8.5k → 12.5k into December, a +47% ramp from today’s pace – when the actual trend since mid-June is 14.5k → 8.5k in the other direction, and every past NIO order acceleration came from a launch. (2) The full 94k backlog converting with zero cancellations. If both hold, 456k works, exactly as you show. So the whole FY case now compresses into one question: what turns the order curve around in the next 8 weeks? That’s the number I’m watching.
$NIO weekly orders YoY: -79% (W31), -72% (W32).
And before anyone says ‘that’s just a launch comp artifact’ – yes. Exactly. Last year’s comparison weeks are the L90 pre-order surge: 36k and 30k orders per week. That artifact is the whole point, because the same one hits Q4 deliveries next: ES8 + L90 drove roughly half of last year’s record 124.8k quarter. Orders show the YoY flip first. Deliveries follow with a lag.
Meanwhile the monthly order trend: May 86k → Jun 77k → Jul 44k → Aug running at ~35k pace. Halved from the launch peak – through the heaviest launch cadence in company history (ES9, L80, 5-seat ES8, updated L90/L60). And July orders (44k) barely exceeded July deliveries (35.9k), which means the backlog isn’t building anymore. It’s draining.
What this table shows in orders in August is what the delivery numbers look like in Q4. The market prices that in advance – and that’s why the stock trades where it trades, record H1 or not.
Just to be clear: I’m long $NIO and underwater. I’d love to be wrong. But the data is the data.
Fair challenge — the flat 36k is intentionally the stress case, not a forecast. You’re right that Q4 seasonally ramps every year. But note why last Q4 ramped: ES8 + L90 launches. That’s also why the comp is so brutal — you’re not comping seasonality, you’re comping a launch. Could history rhyme? Genuinely yes: there’s a real backlog from May/June orders still undelivered, and that can carry Q4 volumes. The honest tension: backlog delivers cars, but weekly order intake (~8.5k) is what has to fund next year’s Q1. I’m long — I’m stress-testing the thesis, not selling it. Flat run-rate is the bar the bulls need to clear, not my prediction.
ELI5: the market has seen this movie twice.
$XPEV and $LI ramped, plateaued, de-rated. Market assumes $NIO is next — and the tape agrees:
• Stuck in the 35-40k band since Oct 2025
• Q2 guide was 110-115k → delivered 107.7k. Missed the LOW end
• …despite launching L80, refreshed L60 AND ES9 that same quarter
Three launches, still a miss = new models cannibalize, not add.
Easy comps end this month. Break the plateau or no re-rate. That’s why not $50
Luxury cars have the highest margins, their brands command the highest loyalty and are the least affected during a downturn (because rich people keep getting richer).
EVs are clearly the future, so explain to me like in 5 how $NIO isn't trading at $50?
Because I don’t think it’s a value trap — I think it’s an unresolved bet, and the market disagrees with me on the odds. To be clear: I don’t know why the stock trades where it does. Nobody does. The XPeng framing is my best attempt to explain the tape, not a fact — take it with salt. What I do know is the math: Dec comps 48k, run-rate is 36k, and orders aren’t accelerating. I’m long because I think that bar gets cleared. If I’m wrong, at least I knew exactly which bar it was.
This is the most common mistake in EV investing right now: reading trailing YoY as a buy signal.
$XPeng, 12 months ago: FY +126%, everyone celebrating. December already +2%. Then Q1 -33% and the stock halved.
NIO’s chart isn’t ‘ignoring’ the +70% YTD — it’s pricing the XPeng path: launch-driven spike, comp wall, negative prints by Q4. December comps a 48k record from a 36k run-rate.
That’s the whole disconnect between the delivery headlines and the tape. Market isn’t blind. It’s early.
(Long $NIO — this is exactly the asymmetry. If Q4 breaks the script, the re-rate is violent. But the burden of proof is on the prints, not the narrative.)
@zen_nns@Derbermens61563 This is a dumb take. Deliveries are up almost 70% year to date. By the end of the year deliveries will still be up a high amount year over year. And that is very good.
I do — that’s literally why I’m long. But here’s the uncomfortable part: 0.7x sales isn’t the market missing the story, it’s the market��s verdict on it. Cheap multiple + 40% growth = the tape saying it doesn’t believe the 40% survives the comps. XPeng traded ‘cheap’ the whole way down too. If Q4 prints hold the growth, the multiple re-rates and we both win. The debate was never cheap vs expensive — it’s durable vs launch-driven.
@R59602975 Yeah, the QT wasn’t about you — it’s about a pattern I keep seeing across EV threads: trailing YoY treated as the thesis. The XPeng chart is just the cleanest recent example of how that ends.
XPeng bulls said the same thing 12 months ago. FY25: +126%. December: +2%. Q1 2026: -33%, stock halved. YTD is a rearview mirror — exit rate is what gets priced. NIO’s December comps a 48k record from a 36k run-rate. If it prints, I’m long and happy. But ‘the annual number looks great’ is literally how the XPeng chart happened.
My $NIO thesis, pinned so I can be held to it:
Long since 2021, averaged down along the way. I post with a deliberately bearish lens, because most of X reads data with zero context.
Example: “Tesla’s declining too.” Sure — with a stale lineup and a couple of refreshes. NIO stayed FLAT while launching ES9, L80, an L60 refresh and the ES8 5-seater. Same headline, opposite disease. Context is everything.
The bear case (mine to beat):
• Stuck at 35-40k/month since Oct 2025
• Holding that level required a launch treadmill
• Q2 guide missed at the low end — WITH three launches in the quarter
• $XPEV and $LI ran this cycle first: ramp → plateau → de-rate
The bull case (what keeps me long):
• Mix shifting premium — NIO brand now ~56% of volume
• Margins rising through a price war, back-to-back non-GAAP operating profits
• Neither XPEV nor LI plateaued while margins improved
Verdict comes this fall: hard comps start now. 40k+ in Oct/Nov with margins intact → turnaround is real. Anything less → the market was right.
Challenge everything above. That’s why I’m here.
Not making a price call — I’m long, actually. But price = future expectations, and if the market’s pricing in the deceleration those comps imply, current levels are rational, not cheap. Add share count up ~20% in 2025 alone and per-share math gets harder. Stress-testing my own thesis here.
Fair pushback on mix — but the 70% is exactly what I mean by context.
July deliveries: 20.5k (’23) ��� 20.5k (’24) → 21k (’25) → 35.9k (‘26). That +71% printed against a base that hadn’t grown in three years.
And watch how fast it melts against real comps. At the current ~36k run-rate:
Aug: +15%
Sept: +4%
Oct: -11%
Dec: -25%
Negative YoY by Q4 isn’t the bear case — it’s the BASE case if the plateau holds. That’s the context the headline number hides. Q4 settles it either way.
@chris_stura Sure, but that’s irrelevant — the market is still pricing $NIO for the same fate as $XPEV and $LI. The pattern is about the ramp/plateau/de-rate cycle, not brand tier.
Fair, “BEV makers” is the tighter wording for 1-2. Doesn’t change the structure though: 1-2 are shared tailwinds, 3-4 are the NIO case — which I said myself. An edge that’s existed for eight years without moving share isn’t answered by listing it again. It’s answered by orders. Q4 will show.
@R59602975@Zoe8uwy One thing: a mechanism connecting those trends to NIO specifically. Every BEV maker in China benefits from 1-4.😉 The differentiated ones (battery health, distributed storage via swap) are genuinely NIO’s edge — but they’ve been the thesis for years while share has gone sideways.
Fair pushback on mix — but the 70% is exactly what I mean by context.
July deliveries: 20.5k (’23) ��� 20.5k (’24) → 21k (’25) → 35.9k (‘26). That +71% printed against a base that hadn’t grown in three years.
And watch how fast it melts against real comps. At the current ~36k run-rate:
Aug: +15%
Sept: +4%
Oct: -11%
Dec: -25%
Negative YoY by Q4 isn’t the bear case — it’s the BASE case if the plateau holds. That’s the context the headline number hides. Q4 settles it either way.