@Ashish1Nanda My referral points got forfeited. Why is it so? Does the account which got opened got closed after two months? In zerodha referral points don't expire.
Acidity!
1 in 4 Indian is living with Acidity.
What is the cause of Acidity?
Most people think it's normal to have acidity or to be dependent on antacids
A thread🧵 on a why regular dependency on antacids is not good,dietary&lifestyle changes to manage acidity.
Lets go👇
We are continuously evolving. Hence an updated thread summarising @kotakneo. I have covered -
a. Pricing
b. Platform
c. Segments
d. Collateral
e. Existing/Upcoming Features
f. Knowledge & Information
g. Customer Service
h. Refer & Earn
Let’s Start……
How to design a tax-efficient salary? There are tweaks. Like meal coupons, mobile bill, fuel bill, driver's salary etc. Here's an example. Worth a chat with HR? Superb story by @apri_sharma. NPS Tier 1 (employer contri) is in both tax regimes. Important.
https://t.co/kLvn7klcNb.
“I was sold to a person in Dubai”
Paramjeet Singh while giving his statement to #DelhiPolice present at the #airport, said: “He used to beat me up so badly. He then sold me off to another man in #Libya.”
The men are among many who left India between February and April this year with hopes of landing #jobs in #Italy.
All of them had got “#visas and #workpermits” through various #travel agencies.
Little did they know that they had been duped and were being sent on a “#donkeyroute” — a term used to refer to the illegal and highly dangerous method hundreds of people undertake to reach Western countries.
Click on the 🔗 below to read what happened 👇🏽
https://t.co/UdRvZHRpHy
Things that happen in India
Nagpur Court rejects Godrej plea.
Abdul Wahab passes away in 1988
Wife sells land to Agrawals in 1988
Godrej buys it from Agrawals in 2022 for ₹227 crore.
Starts advertising
Abdul's family goes to court
Says under Muslim Law, mother can't serve as natural guardian
Godrej contests case saying it exceeds the applicable limitation period
Court says No.
Period of limitation under Muslim law BEGINS not from date of individual's death. But from express denial of title.
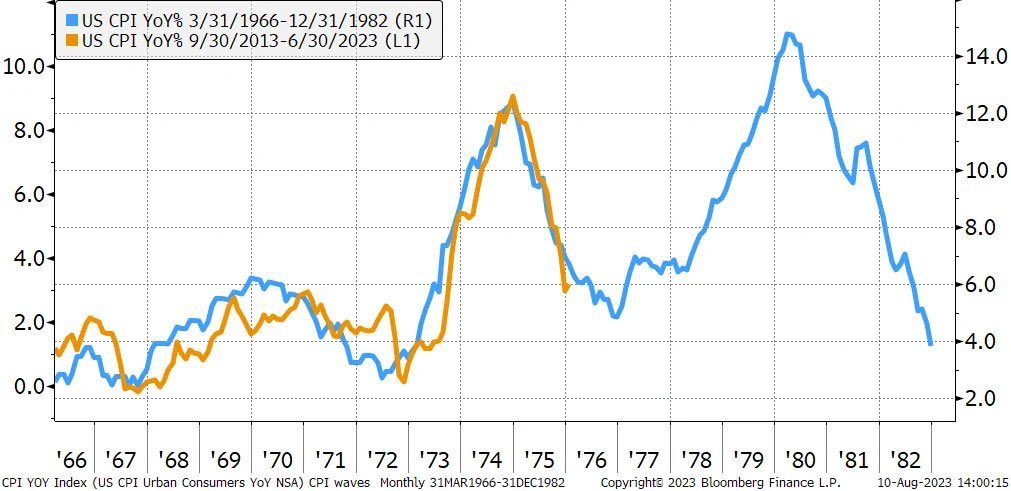
1970s inflation vs 2020s inflation:
When you compare the inflation rates from 1972-1976, it’s almost identical to today.
However, 2 years later we saw inflation spike to 11%.
The peak inflation rate in the 1970s aligns perfectly with the 2022 peak.
Are we about to see another (and bigger) wave of inflation?
Or is this just a wild coincidence?
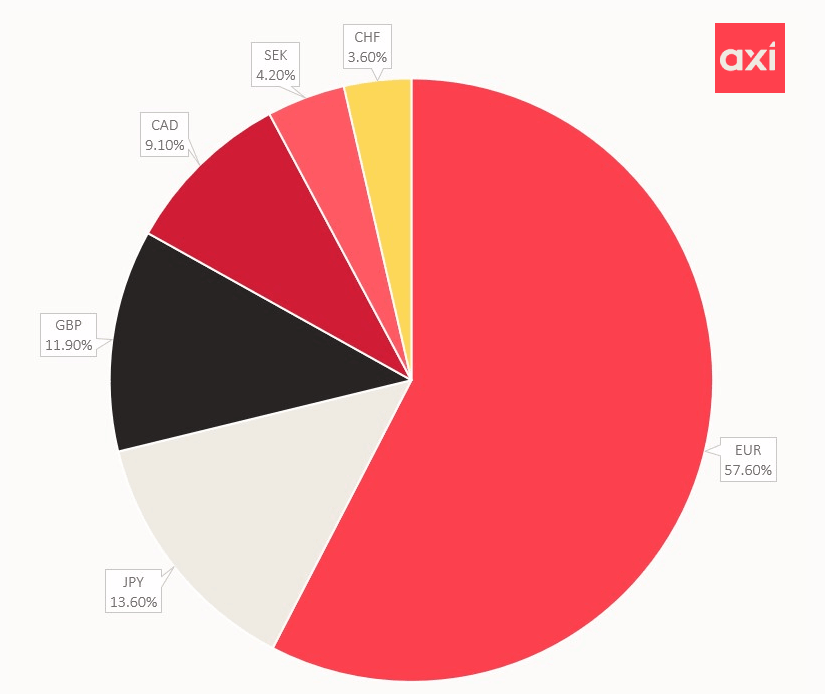
How is the US Dollar Index Calculated?
The US central bank first developed the US Dollar Index in 1973 to offer an average external bilateral trade-weighted value for the Greenback. The demise of the gold standard and the introduction of variable exchange rates were the catalysts for this.
Below is the weighting of currencies that made up the DXY.
RBI has recently launched a new portal - UDGAM, allowing you to search for unclaimed deposits across multiple banks using a single, common web interface.
https://t.co/YlhIcrKWie
@suchetadalal@moneylifers@yogtoday
A short thread on how we got here 🧵
King of Spain at the final day of Wimbledon. This looks great.
Very rare to see this level of tailoring nowadays, even on the wealthy. So let's talk about some of the reasons why it's great. 🧵
Before, the only way to learn from investing legends was to get into Columbia Business School.
It featured greats such as Ben Graham, Joel Greenblatt & Bruce Greenwald.
Today, the internet has made education available to all for FREE!
The top 5 'lectures' by fund managers:
Technical Analysis Methods:
Technical analysis is a process used to quantify the price action on the chart of a security & identify trading opportunities based on the patterns created by buyers & sellers. Technical analysts believe past & present trading activity in price changes can be used to create an edge for what will happen next. Technical analysts try to establish a higher probability of one thing happening over another or to create a good risk/reward ratio through trade entry & management as it plays out.
What Are The 4 Basics Of Technical Analysis?
Markets Alternate Between Range Expansion And Range Contraction.
All charts go through cycles of volatility & tight trading ranges. Understanding the current phase is crucial for trade management & position sizing. Downtrends tend to be more volatile than uptrends.
Trend Continuation Is A Higher Probability Than A Reversal.
A chart moving primarily in one direction will tend to continue in that path of least resistance until the trend is permanently broken. It’s better for profitability to trade in the direction of the current trend on a chart.
Buy the breakout in ranges.
Buy the dip in uptrends.
Sell the rallies in downtrends.
Sell short the breakdowns in downtrends.
Trends End In One Of Three Ways: Blow Off Tops, Capitulation Bottoms, Or Bending.
Uptrends can end on a huge expansion on volume & price action followed by a big reversal in direction. Long upper wicks on candles and black candle reversals are usually the two biggest signals.
Downtrends can end on huge drops in price that extend far from short-term moving averages that are followed by big candle reversals with long lower wicks.
Uptrends can form curved upper patterns that look like an upside down cup to put in a top.
Downtrends can form curved lower patterns that look like a cup to put in a bottom.
Momentum Precedes Price.
Strong directional price action generally continues to move in the direction of the strength. Gaps usually continue in the direction of the gap in price. Big candles are usually followed by candles with the same directional bias.
How Many Types Of Technical Analysis Are There?
There are two major schools of thought within technical analysis: predictive technical analysis & reactive technical analysis.
Predictive technical analysis is practiced when traders project what will happen next in price movement based on a current chart pattern. They look for the clues of volume, trendlines, & the levels of support & resistance to project the probabilities of the future price movement. It’s attempts to predict the future price action based on the past price pattern.
Reactive technical analysis is practiced when trader’s entries & exits are based on price signals that backtest as profitable by creating good risk/reward ratios. Their quantified price signals tell them when to get in for a good probability of success & where to get out with a small loss or to lock in a profit. Reactive traders rely on trade management as the price action plays out to minimize losses & maximize gains for profits. They rely on quantified systems to make money in the markets, not knowing the future
The best use of both types of technical analysis is to create good risk/reward ratios. You know where you will get out if the trade doesn’t work out & the potential magnitude of the win if right. This is the true value of technical analysis
What Are The 4 Types Of Indicators?
Trend Indicators
They measure the direction of price action through quantifying trends on a chart. They include moving averages & parabolic SAR
Momentum Indicators
They measure the magnitude & strength of movement of price action on a chart. They include the Stochastic Oscillator & RSI
Volatility Indicators
They quantify the size of the trading range on a chart. They include Bollinger Bands and ATR
Volume Indicators
They quantify the price action in correlation to the volume. They include On Balance Volume & Volume Rate of Change
Market Wizard Linda Raschke’s 12 Technical Trading Rules:
1. Buy the first pullback after a new high. Sell the first rally after a new low.
2. Afternoon strength or weakness should have follow through the next day.
3. The best trading reversals occur in the morning, not the afternoon.
4. The larger the market gaps, the greater the odds of continuation and a trend.
5. The way the market trades around the previous day’s high or low is a good indicator of the market’s technical strength or weakness.
6. The previous day’s high and low are two very important “pivot” points, for this was the definitive point where buyers or sellers came in the day before. Look for the market to either test and reverse off these points, or push through and show signs of continuation.
7. The last hour often tells the truth about how strong a trend truly is. “Smart” money shows their hand in the last hour, continuing to mark positions in their favor. As long as a market is having consecutive strong closes, look for up-trend to continue. The up trend is most likely to end when there is a morning rally first, followed by a weak close.
8. High volume on the close implies continuity the next morning in the direction of the last half-hour. In a strongly trending market, look for resumption of the trend in the last hour.
9. The first hour’s range establishes the framework for the rest of the trading day.
10. A greater percentage of the day’s range occurs in the first hour then was the case in the past, and thus it has become increasingly important to trade aggressively if there are early signs of a strong trend for the day.
11. There are four basic principles of price behavior which have held up over time. Confidence that a type of price action is a true principle is what allows a trader to develop a systematic approach. The following four principles can be modeled and quantified and hold true for all time frames, all markets. The majority of patterns or systems that have a demonstrable edge are based on one of these four enduring principles of price behavior. Charles Dow was one of the first to touch on them in his writings.
Principle One: A Trend Has a Higher Probability of Continuation than Reversal
Principle Two: Momentum Precedes Price
Principle Three: Trends End in a Climax
Principle Four: The Market Alternates between Range Expansion and Range Contraction!
12. In the world of money, which is a world shaped by human behavior, nobody has the foggiest notion of what will happen in the future. Mark that word – Nobody! Thus the successful trader does not base moves on what supposedly will happen but reacts instead to what does happen.