FAKE DATA
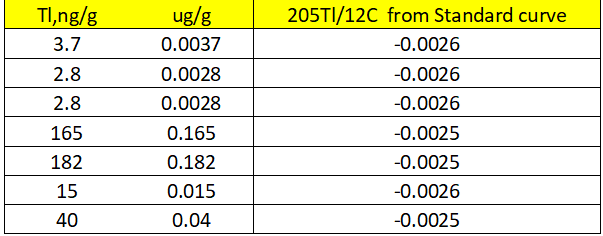
1. The general procedure for quantification in analytical testing is to make a standard curve(SC) first, and then the signal of the sample is quantified through the standard curve.If the contents of Tl were inputed into SC in Figure 1.the signals WERE negative!!!
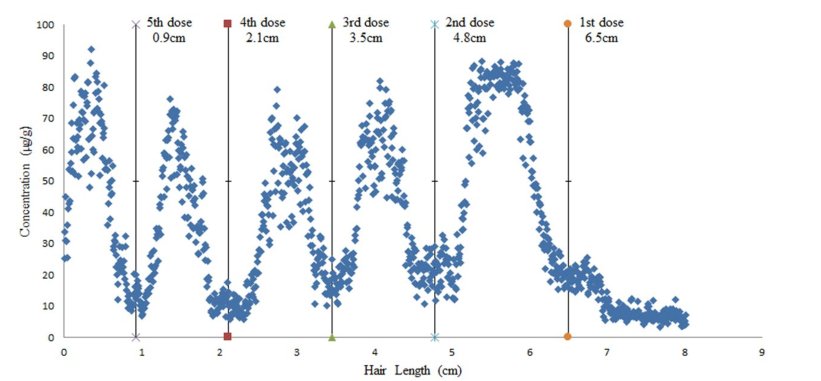
3.The graph shown in Figure 2A is also weird, the resolution is 0.9cm steps, the data that should NOT be continuous, but scattered, and the peak of Tl should not be too sharp, but be a flat peak, see Sci Rep. 2017 Jun 13; 7(1): 3426.doi: 10.1038/s41598-017-03660-6
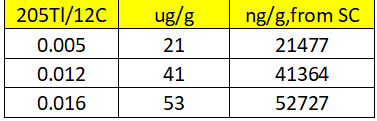
2. The 205Tl/12C signal in Figure 2B is about 0.001-0.020, if the 0.016 signal is inputed into the standard curve y=0.000352x-0.00256, the content obtained is 52727ng/g. The figure 2B are NEVER possible.