Bitcoin (BTC) - For the past few months I’ve had my plan for trading BTC on the spot market, and I’ve been executing it quietly, without any fuss.
Over the last few months I published a few posts explaining the confluences in this zone.
The first buy was at 58k.
If we make a new low, I’ll add more long positions.
Where to really buy $BTC before the next bull run ?
My DCA zone: 39-58 k
Why here:
- 61.8% Fib of the entire move from 2012
- 61.8-78.6% Fib of the last impulse
This is my mathematics + patience.
Where do You plan to buy ? Higher, lower ?
#Bitcoin#BTC#Crypto
ETH keeps stalling under a 1:1 correction on the lower timeframes, and right now that's the lid on price.
The current bounce has run the same distance as the previous corrective leg and stopped there. Before ETH take any move to higher levels seriously, that LTF resistance has to break first.
You can map it with a simple rectangle copied from the earlier leg, or with the Fib Extension tool at 1 (100%).
if ETH prints a new low, project the same correction from it. That gives you the updated first LTF resistance.
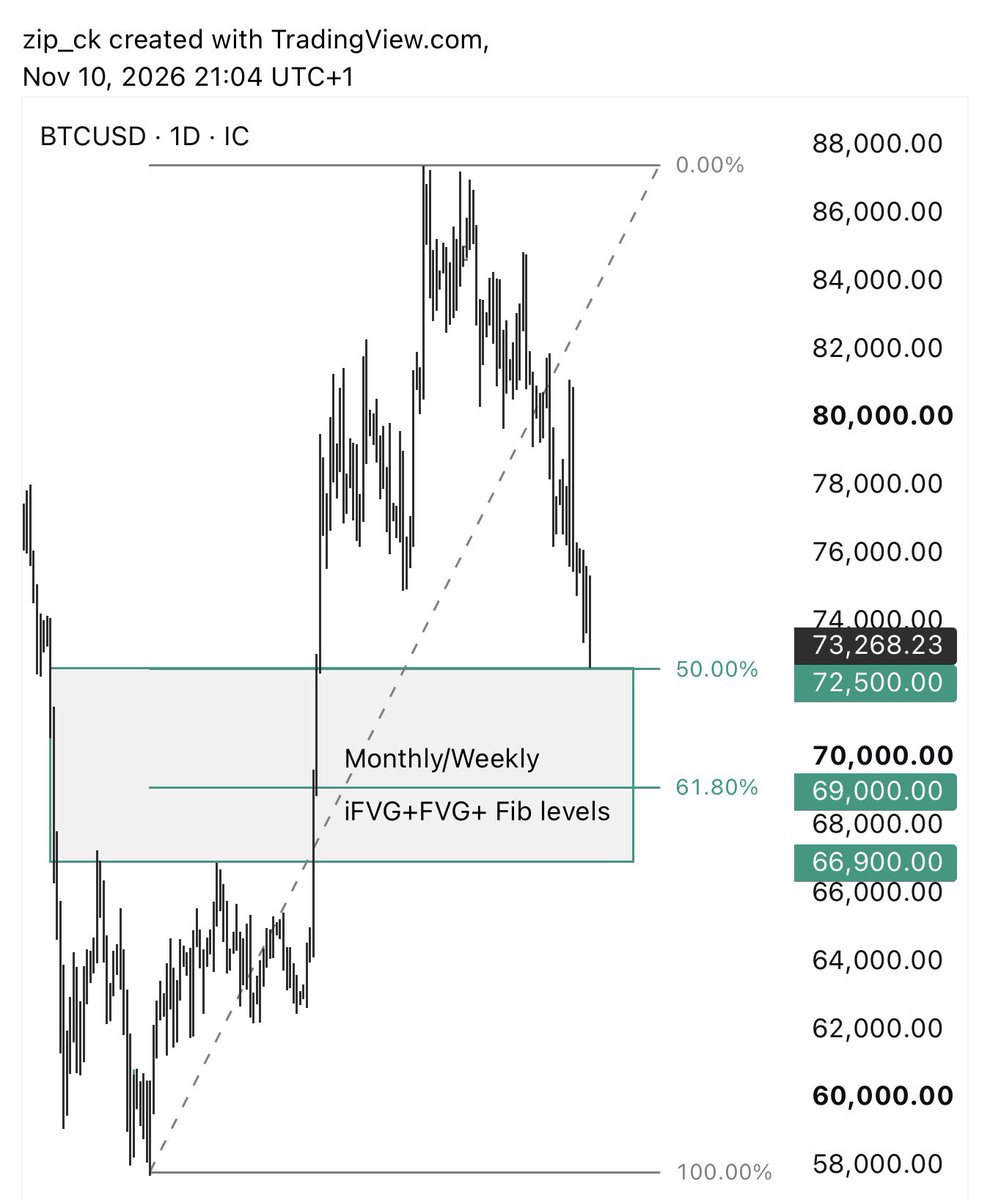
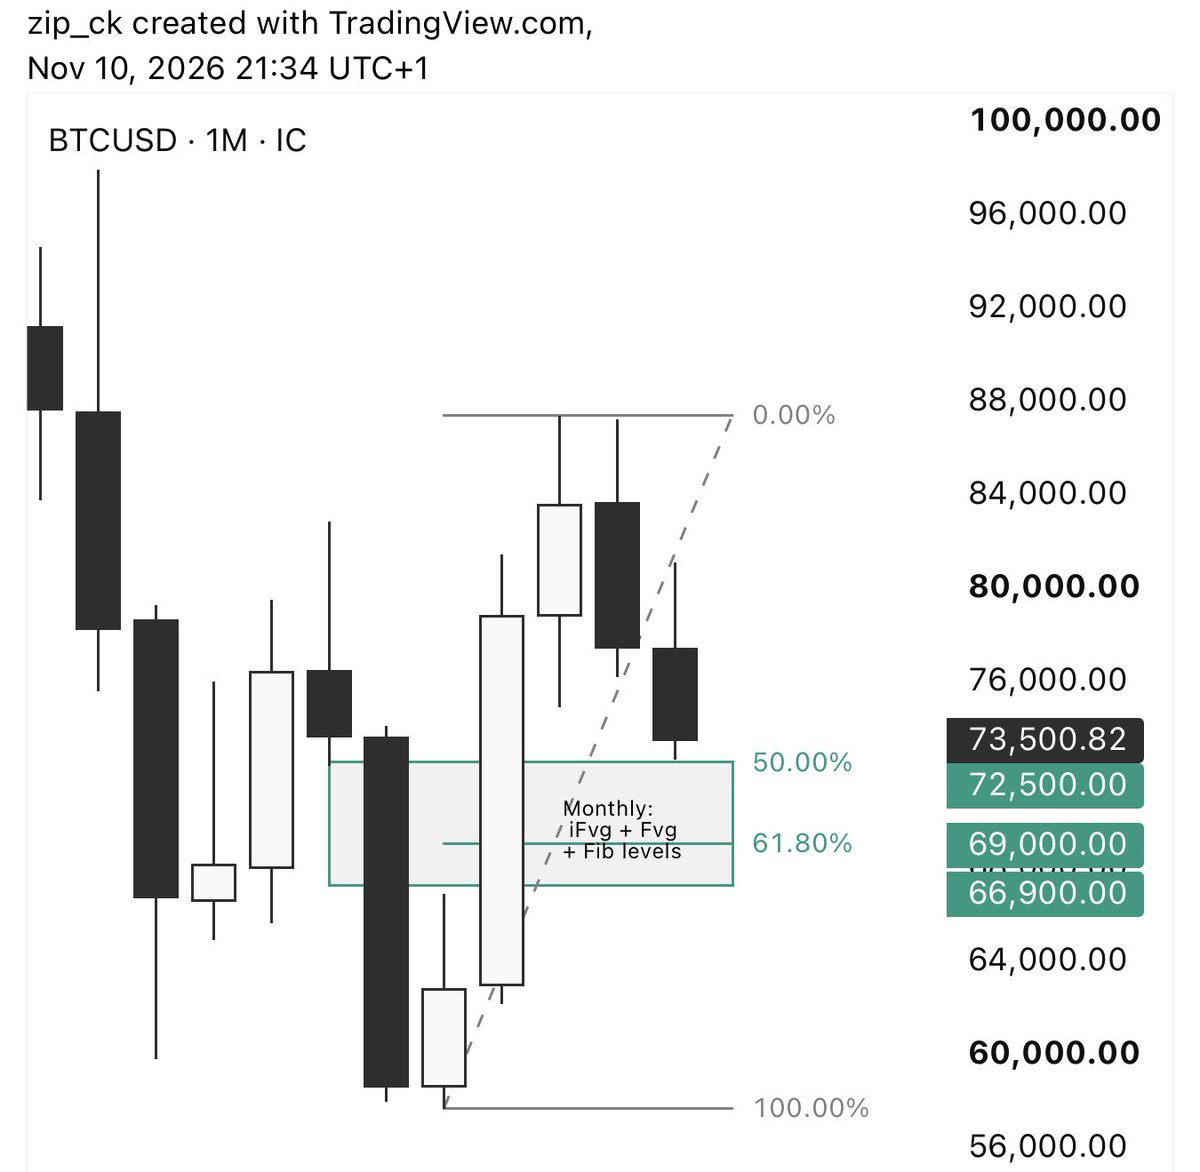
@Ellaweb_3 Inside that 72-74k box, the line I care about is 72.5k, the 50% retracement on my chart, and it still hasn't been tagged.
If it gives way, 69-66.9k around the 61.8%-66% is the next area where l'd expect a real reaction.
Microstrategy (MSTR) – This analysis from January 2026 is still in play.
In my opinion, this harmonic pattern will hold – the green zone looks good to me for accumulating MSTR (DCA).
Do you see it too?
#MSTR weekly/monthly chart – Potential end of decline in the bullish zone of the harmonic pattern.
On the weekly #MicroStrategy $MSTR chart, we likely see a bullish harmonic pattern forming. After a strong rally followed by a correction, the price is steadily moving toward a key confluence zone around 73–126, where point D of the harmonic pattern is located.
This area is reinforced by several overlapping Fibonacci levels:
✅ 78.6%–88.6% retracement of the last major uptrend
✅ 161.8% retracement of the previous corrective pattern
What are your thoughts on this zone ?
ETH respected the ~2k support zone I mapped in advance almost to the dollar, and it's now making its first tentative attempts higher.
If that push turns into a real move, the first resistance worth knowing on the daily chart is 2278-2307.
It's a DiNapoli cluster, where Fibonacci levels from separate swings land in the same narrow band, and that kind of overlap is usually where sellers get their first proper chance to step in.
I agree with @RektProof that the area around 2k on ETH will most likely be hit, because it is an important support level that the market will want to test.
Around the 2000 area, three independent levels are stacking on top of each other:
• 61.8% Fibonacci retracement
• 100% Fib Extension (measured move)
• Bullish daily Fair Value Gap
If price actually reaches this area, the reaction (or lack of one) will tell us a lot about whether bulls still have control.
@TedPillows My ETH chart lines up closely with
this, my next targets are 2170 and 2280, right next to your 2150 and 2250 clusters. That overlap is where I'II watch how sellers respond.
What's capping Tesla right now, technically speaking ? A 1:1 correction on the weekly chart.
@elonmusk be the largest individual shareholder, but the chart answers to geometry. The current leg mirrors the earlier one at equal size, and price stalled right at the top edge of that structure. Until it breaks, I keep expecting continuation lower.
Tip: if price makes a new low, project the same geometry from that low. The top edge becomes your new resistance.
$NVDA first real support on the monthly chart, as I read it sits in the 146–155 cluster.
What makes this zone worth watching is that it doesn't rest on a single line.
Two separate Fibonacci measurements, taken from two different waves, they are building this zone: 38.2% retracement from one swing and 61.8% retracement from the other.
In DiNapoli terms that overlap is a confluence zone to which the price very often reacts.
That's why 146–155 is the first place I'd look for buyers to show up.
ETH tagged the ~2k support zone I've been pointing to.
Around 2,000 three separate pieces of my map stack together: a fair value gap left behind by the earlier move, the 61.8% retracement, and a 100% Fibonacci extension.