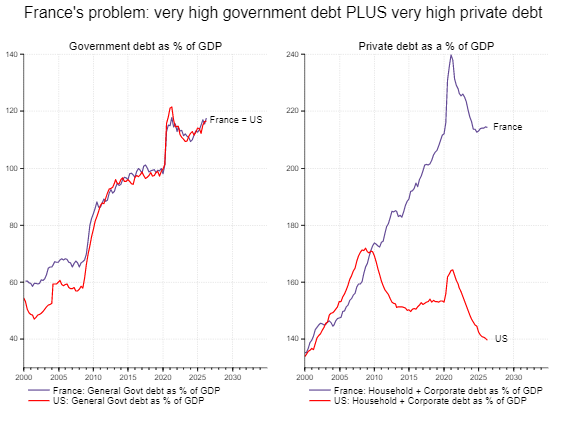
Here's why France has a much bigger debt problem than the US. While France's public debt ratio is the same as the US, its PRIVATE debt ratio is WAY HIGHER. With both maxed out, there's no easy way out. The only question is how much more political pain to force the adjustment.
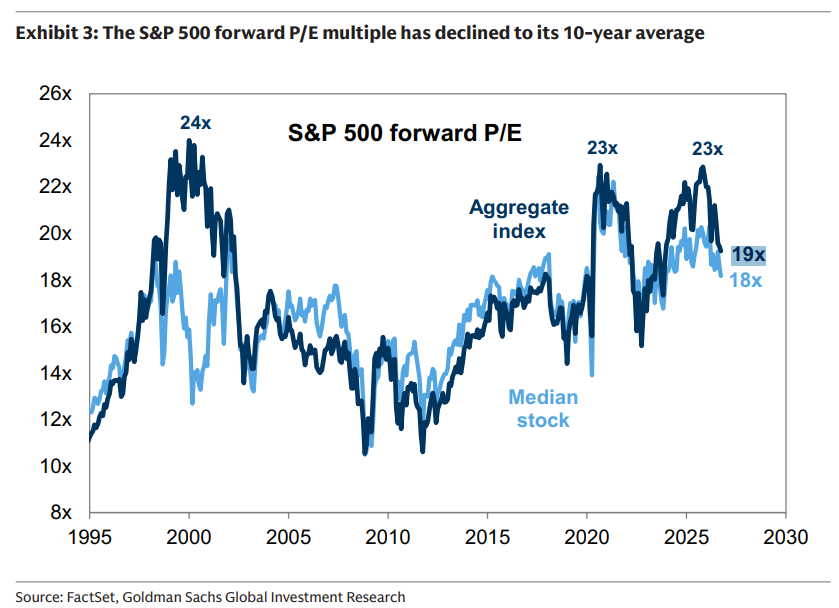
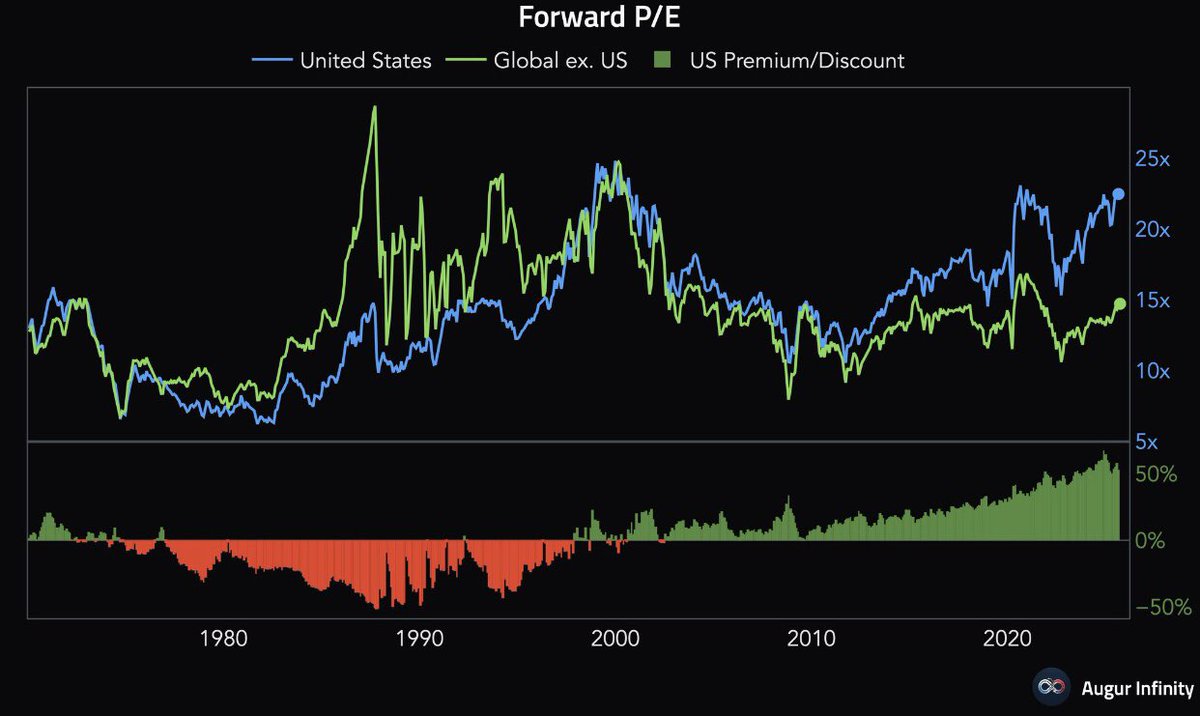
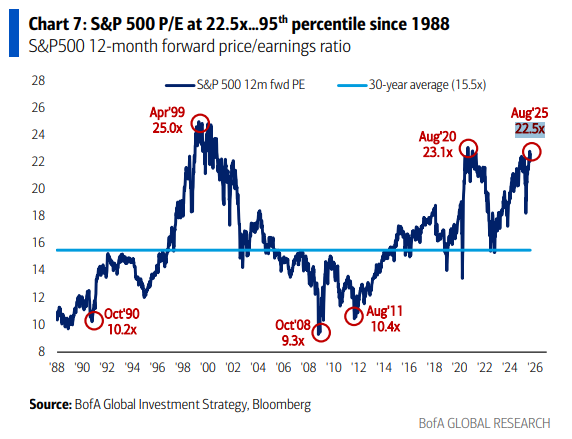
GS: Despite a 14% YTD return for the S&P 500, the forward P/E multiple has declined from 22x to 19x this year and now matches its 10-year average.
$RSP 18x
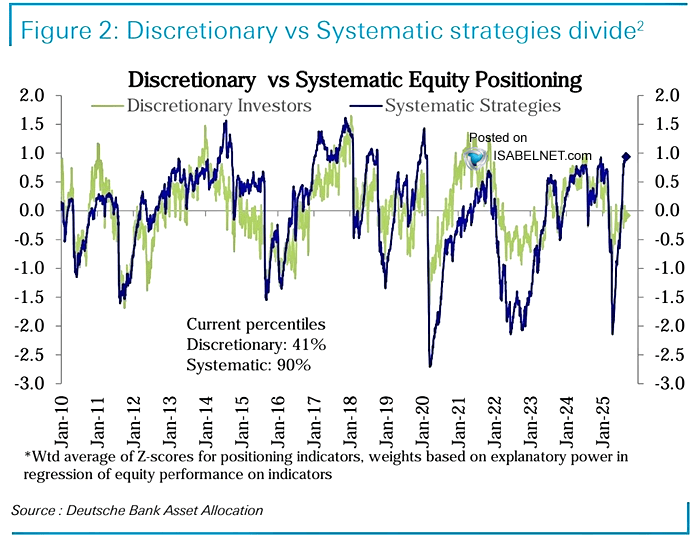
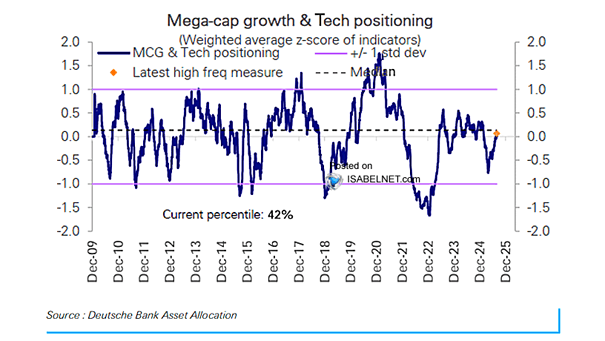
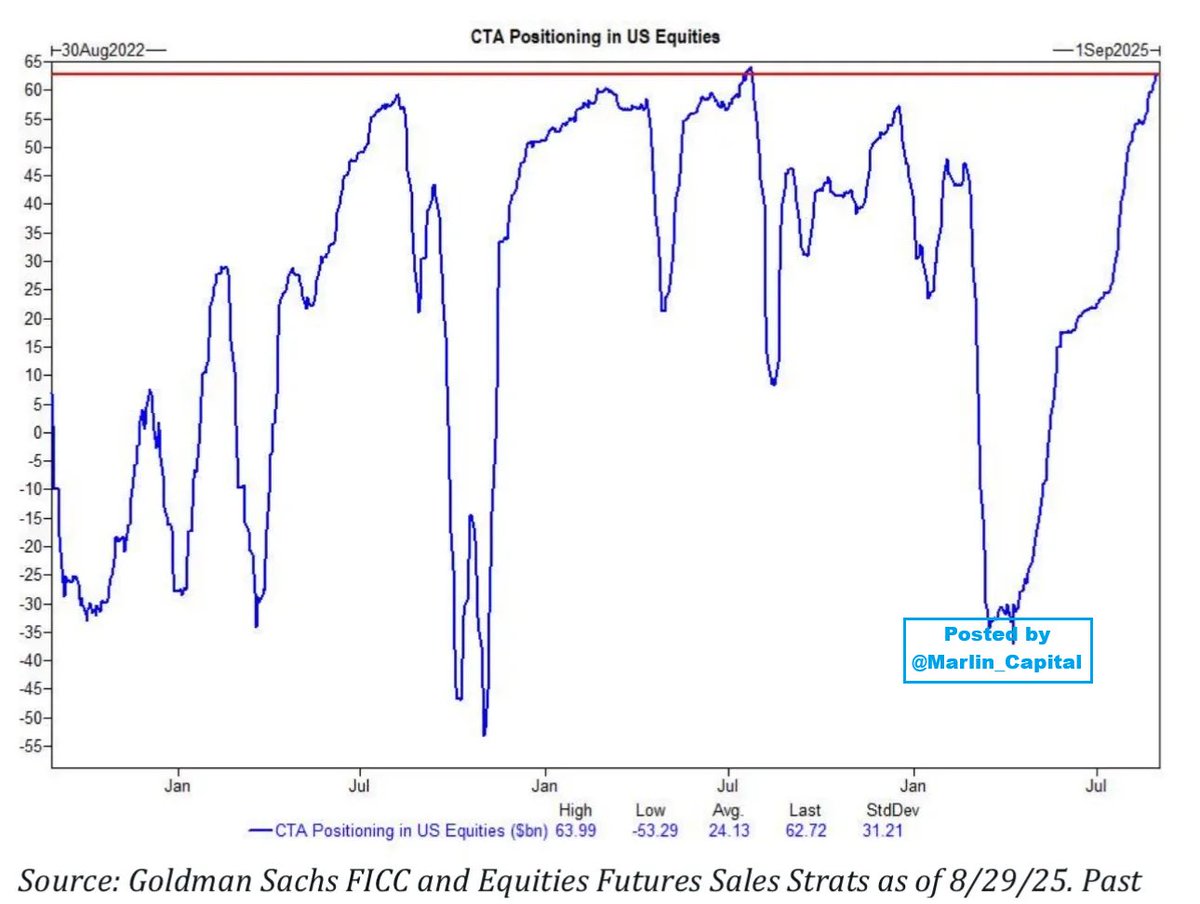
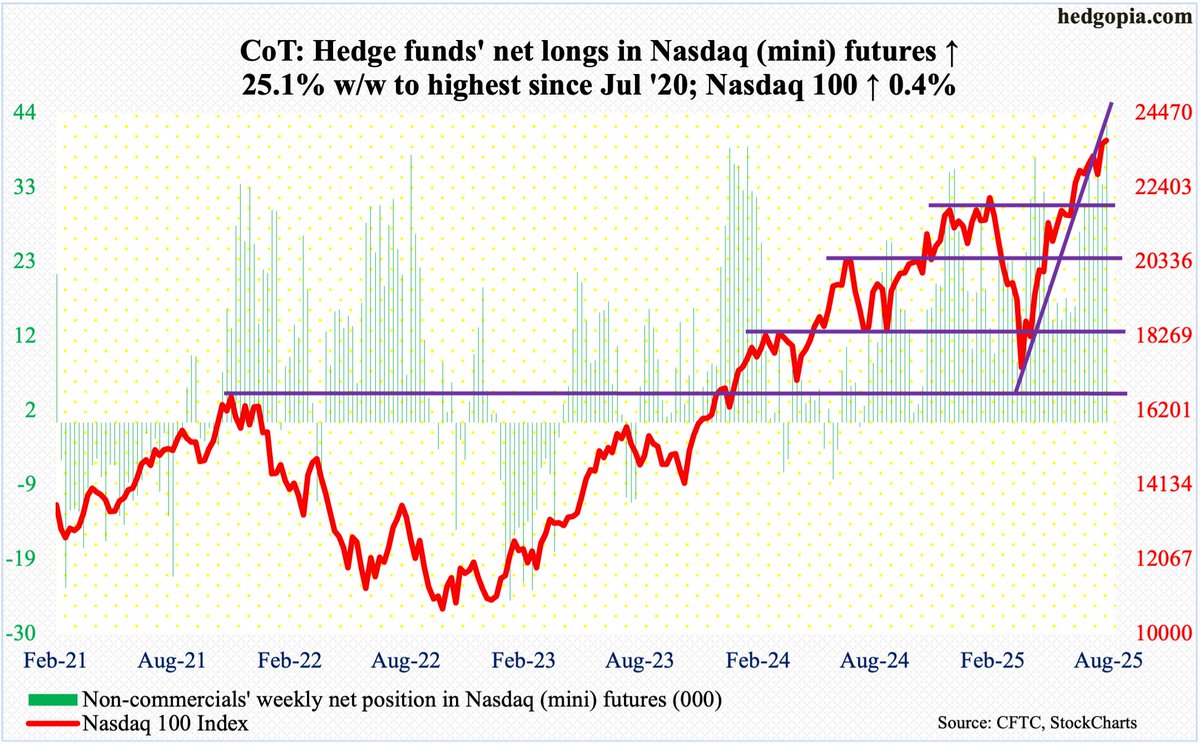
Positioning update: Exposure to #equities, and in particular the #Mag7, is not at extremes. Such provides some support to the current #market if they are forced to start buying heading into quarter end.
h/t @ISABELNET_SA
Forces for the steepening, or widening of the long-duration term premium, to its highest level in 4y, include concerns about US debt and #deficits and rising supply of long-duration #debt around the world, chart @MorganStanley
Holy Moses do the A.I. Focused fund flows look parabolic... and like Moses parting the see, that wall of water eventually collapsed... and like the Egyptian legion they didn't know when the wall of water would collapse.
I just keep coming back this chart.
The #market is not as "healthy" as it seems on the surface when #earnings growth for the ENTIRE #index is only coming from a handful of #stocks.
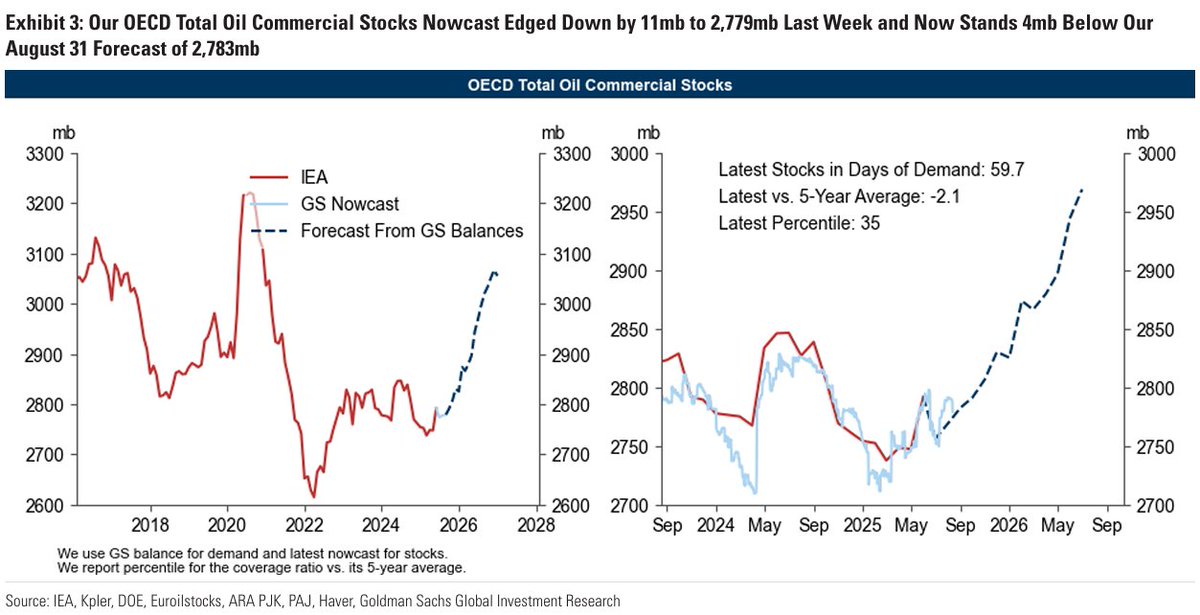
Although it is not as significant as the IEA's ~4mb/d surplus, global observable oil inventories are actually increasing.
Of course if a surplus of ~4mb/d were expected, as in the IEA's balance, oil prices would have already collapsed. Therefore it is unlikely to be that significant.
However the balance for the Q4 2024 and Q1 2025 is definitely weak. Oil prices may soon test the low point of the liberation day.
#oott #com
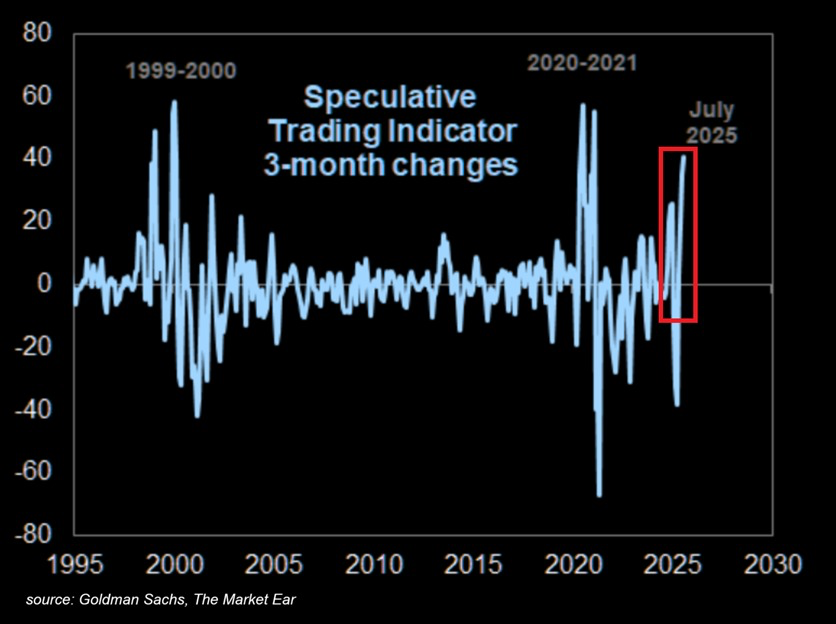
Risk appetite is skyrocketing:
The Speculative Trading Indicator just posted one of its sharpest 3-month spikes on record, according to Goldman Sachs.
This indicator tracks trading volumes in penny stocks, unprofitable companies, and stocks with EV/sales above 10x.
Historically, only the 2000 Dot-Com Bubble and the 2020–2021 meme stock mania saw larger jumps.
Furthermore, penny stock and high-multiple stock trading volume has ranked in the top 2% and 4% of all months since 1990.
Unprofitable stock trading ranked in the top 15%.
Speculative trading has gone parabolic.
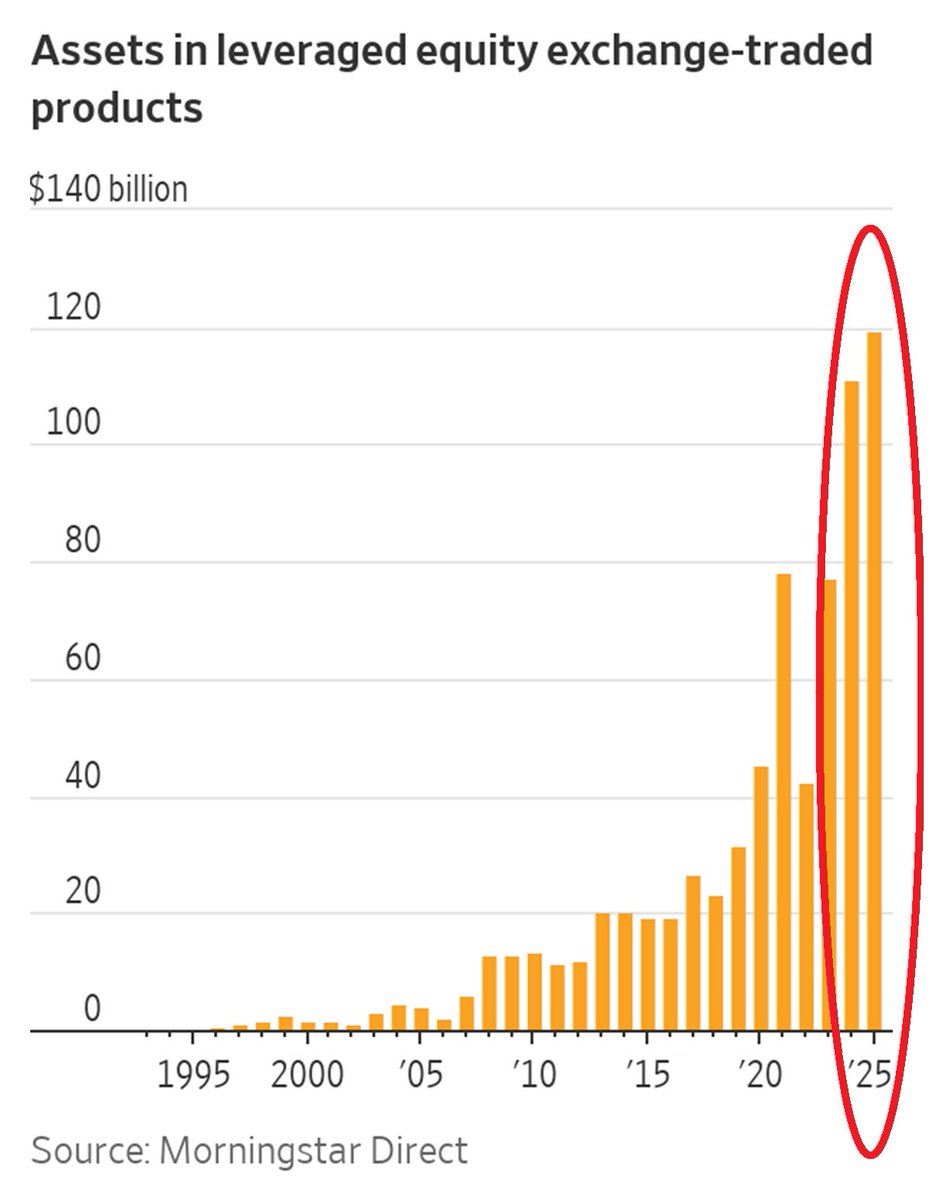
‼️HOLY COW:
US leveraged equity exchange-traded products' Assets Under Management hit ~$120 BILLION, an all-time high.
In 2022, the asset size of these products was ~3 TIMES lower.
Over the last 5 years, trading these risk products has skyrocketed.
Incredible.
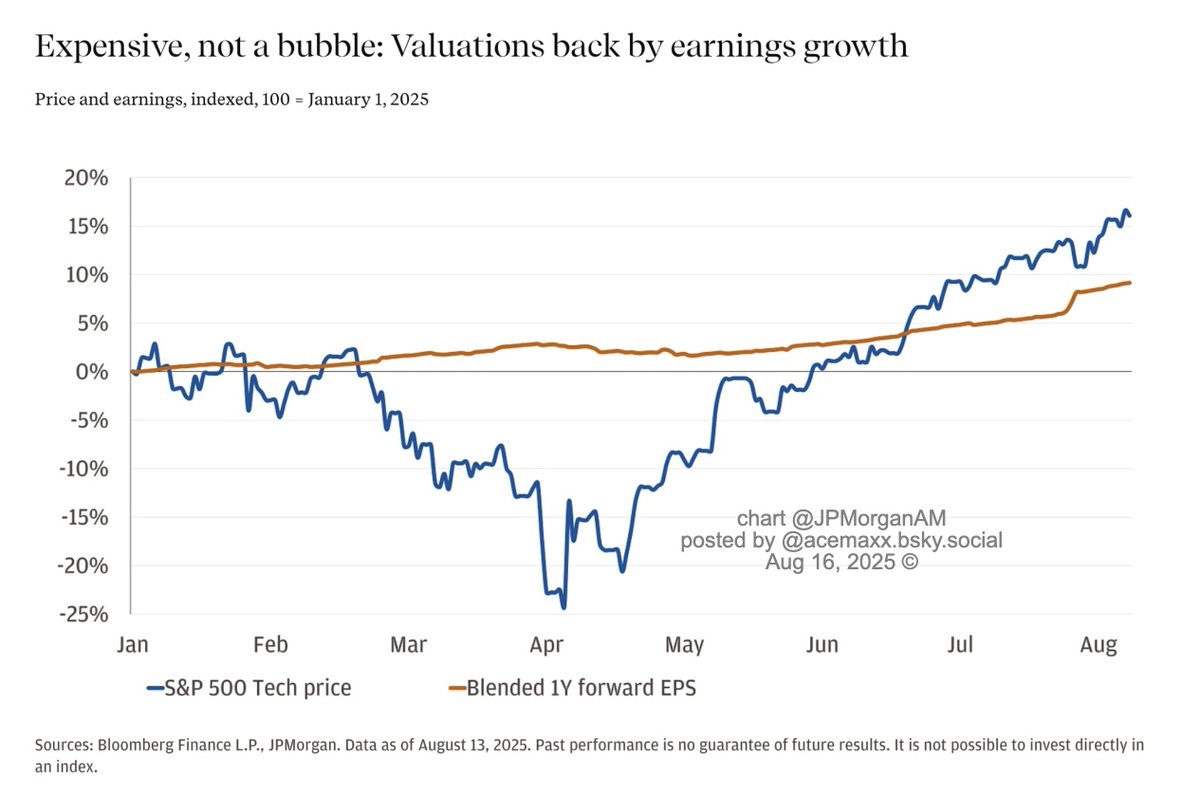
Key drivers include companies at the heart of the #AI ecosystem—hardware, #software, data #infrastructure - delivering above-market earnings growth and raising forward guidance, chart @JPMorganAM
You can almost see the "Ex Mag 7" on this chart when looking at the Bloomberg Mag 7's gain of 2,800% since inception in 2015. Almost...
Bloomberg Mag 7 since March 2015: +2,800%
Bloomberg 500 Ex Mag 7 since March 2015: +129%
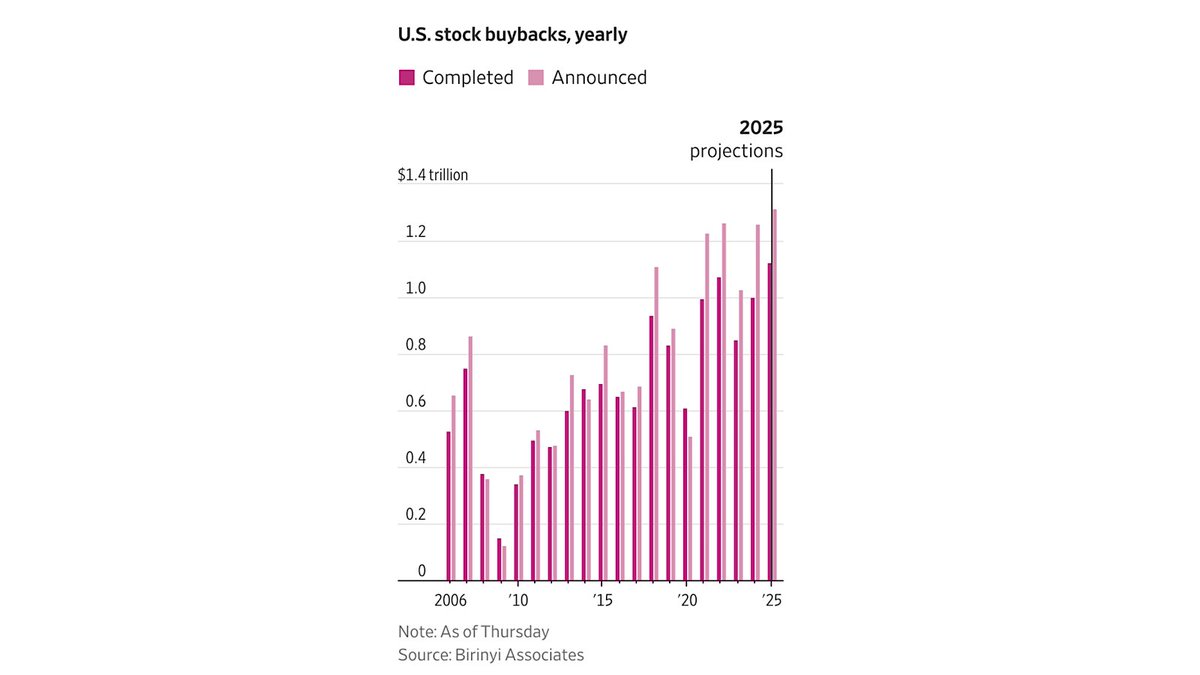
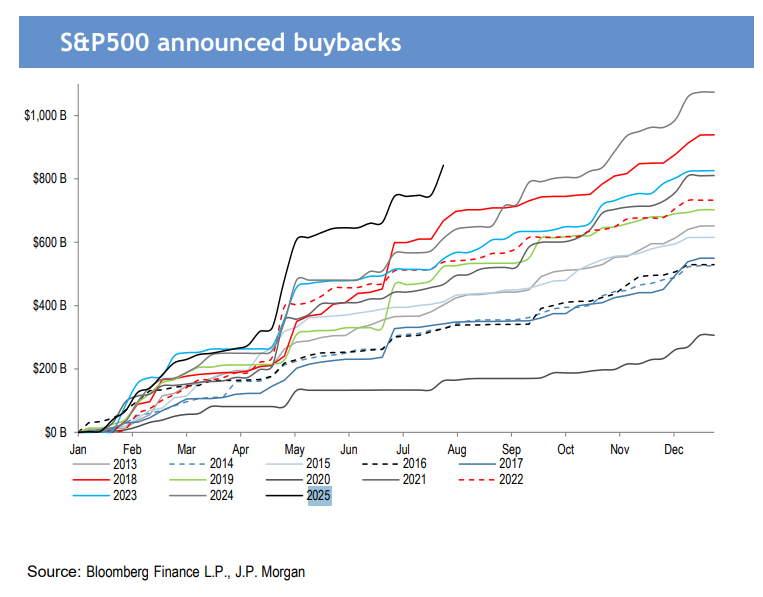
𝐄𝐥𝐞𝐯𝐚𝐭𝐞𝐝 𝐜𝐨𝐫𝐩𝐨𝐫𝐚𝐭𝐞 𝐦𝐚𝐫𝐠𝐢𝐧𝐬 𝐚𝐫𝐞 𝐬𝐮𝐩𝐩𝐨𝐫𝐭𝐢𝐧𝐠 𝐫𝐞𝐜𝐨𝐫𝐝-𝐥𝐞𝐯𝐞𝐥 𝐛𝐮𝐲𝐛𝐚𝐜𝐤𝐬.
🇺🇸US companies are setting new records in 2025 buybacks—$983.6 billion repurchased so far and on pace for $1.1 trillion+ by year-end. This mega repurchase spree is supercharging balance sheets and fueling the US stock rally 🚀📈
https://t.co/dG8aCU0EzB
More via @wsj ⬇️
https://t.co/TOikkeUqJ1 #news #Buybacks #Investing #compensation #inflation #deregulation