Announcing #0xtools: Always-on Profiling for Production Systems by @tanelpoder
Now you can get detailed drill-down into (intermittent) performance problems, with visibility at thread level and OS kernel activity too! Runs on your 10+ year old Linux too!
https://t.co/nVga2xRT4D
Attention! On Tuesday, June 25, 2024 at 12:00pm EDT I will announce and demo what I've been building & using for the last five years. (No it's not AI 😛)
This will by far be my biggest contribution to this industry.
Be there or risk getting left behind!
https://t.co/fPN871ndr9
Attention! On Tuesday, June 25, 2024 at 12:00pm EDT I will announce and demo what I've been building & using for the last five years. (No it's not AI 😛)
This will by far be my biggest contribution to this industry.
Be there or risk getting left behind!
https://t.co/fPN871ndr9
Attention! On Tuesday, June 25, 2024 at 12:00pm EDT I will announce and demo what I've been building & using for the last five years. (No it's not AI 😛)
This will by far be my biggest contribution to this industry.
Be there or risk getting left behind!
https://t.co/fPN871ndr9
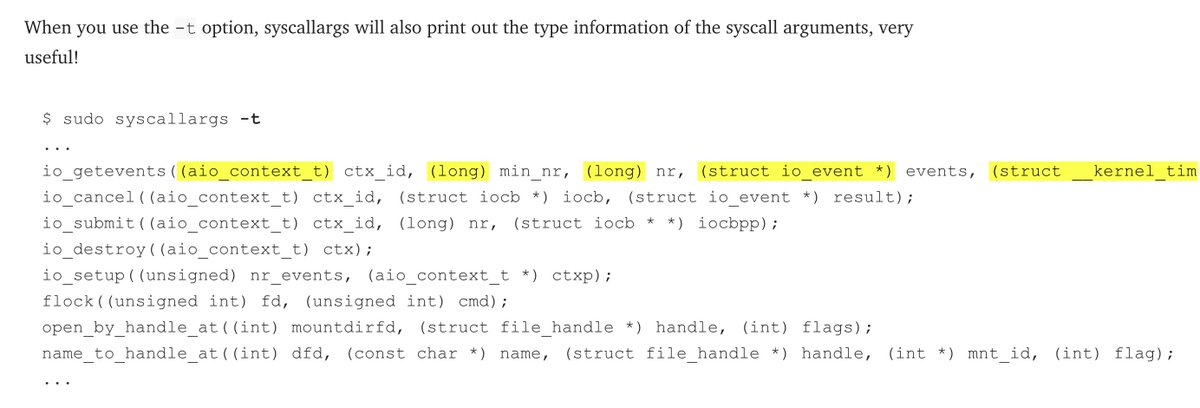
I usually write tools to first solve my own problem (and later make the worthy ones public). Syscallargs is already super-useful and helps me to save multiple seconds of time every day!
https://t.co/wfOBqGwAqh
Somehow I didn’t yet have the time/the need to look into @0xtools I regret that now after having had a first look. Excellent stuff as always by @TanelPoder
Just watched @TanelPoder presentation on Profiling Linux Activity for Performance and Troubleshooting
I like: hearing "group by" when reading "uniq -c" 😀
I enjoy: seeing examples on @MySQL and @PostgreSQL
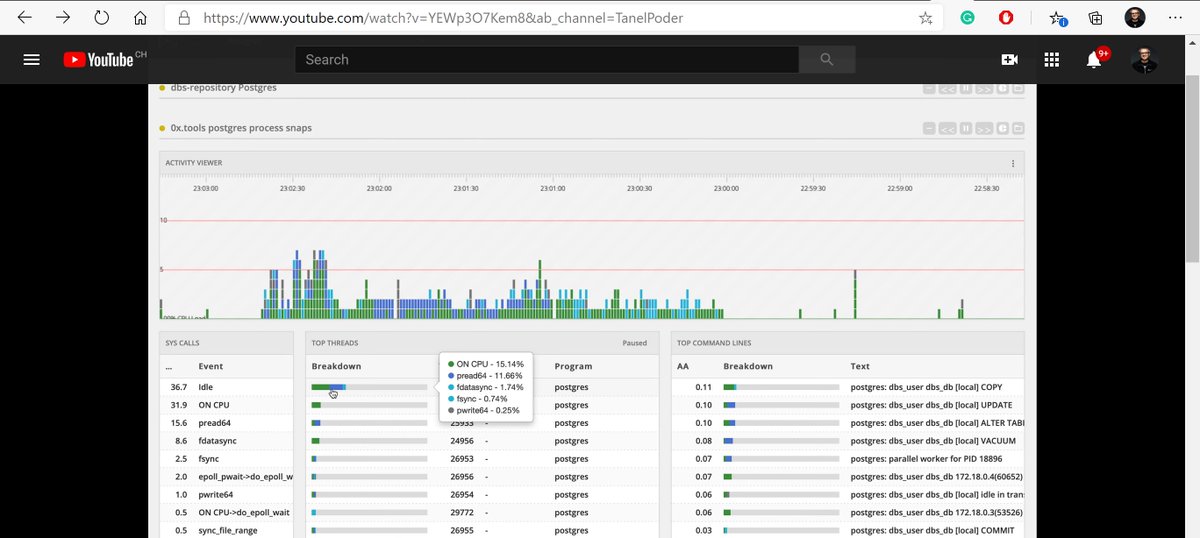
I love: this mysterious GUI displaying @0xtools samples:
Amazing insight on IO processing, os locking, and indepth visualisation of every thing using @0xtools. Plus how to assemble powerfull machine. Thanks @TanelPoder for sharing..
Have you heard about the open source tool VisiData? It blew my mind and brought back some nostalgia!
I'm already using it for command line Linux performance analysis with https://t.co/nVga2xRT4D xcapture data :-)
https://t.co/4DQXk8gyZJ
https://t.co/oQHqns95xz
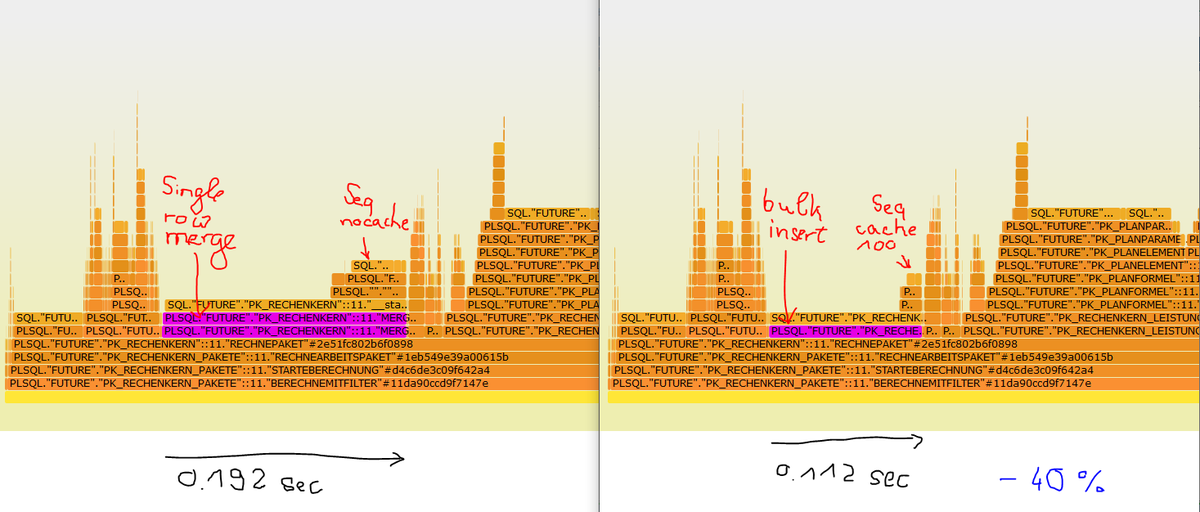
Tuning #PLSQL using dbms_hprof and flamegraphs is fun!
While optimizing a merge operation I found a spike caused by a before row insert trigger that used a non cached sequence. Wouldn't have noticed this otherwise.
#aced@OracleDevs@OracleDatabase#sql
Have you heard about the open source tool VisiData? It blew my mind and brought back some nostalgia!
I'm already using it for command line Linux performance analysis with https://t.co/nVga2xRT4D xcapture data :-)
https://t.co/4DQXk8gyZJ
https://t.co/oQHqns95xz
Announcing #0xtools: Always-on Profiling for Production Systems by @tanelpoder
Now you can get detailed drill-down into (intermittent) performance problems, with visibility at thread level and OS kernel activity too! Runs on your 10+ year old Linux too!
https://t.co/nVga2xRT4D