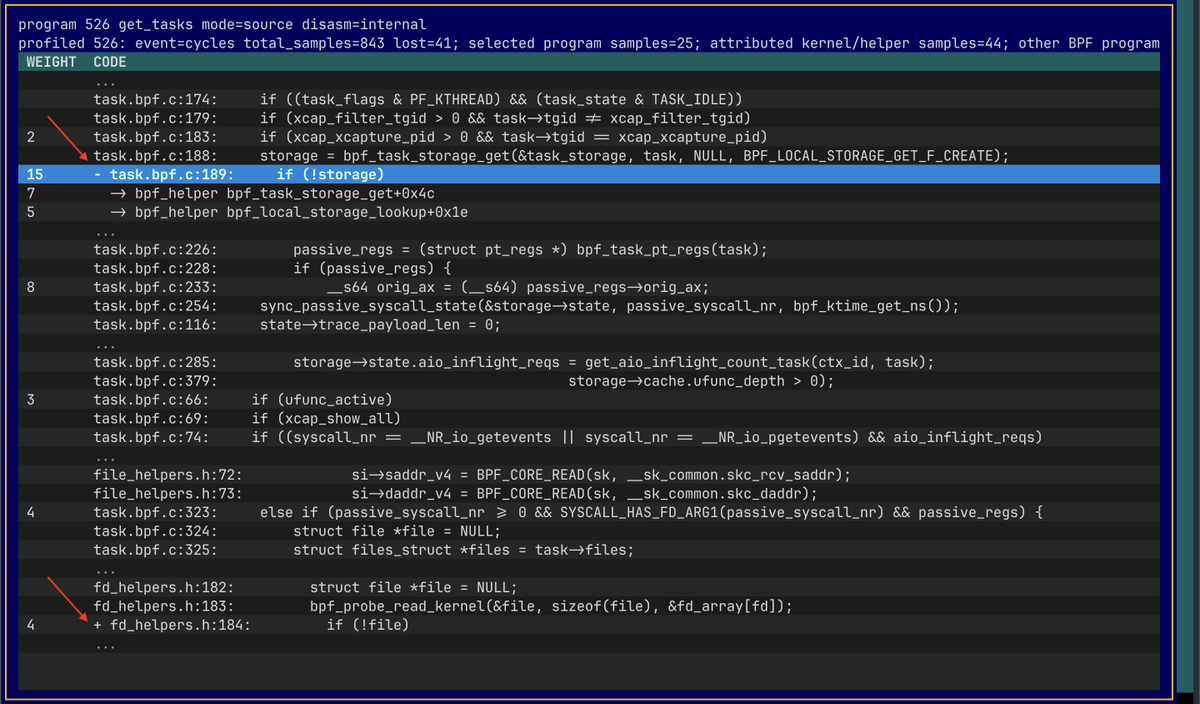
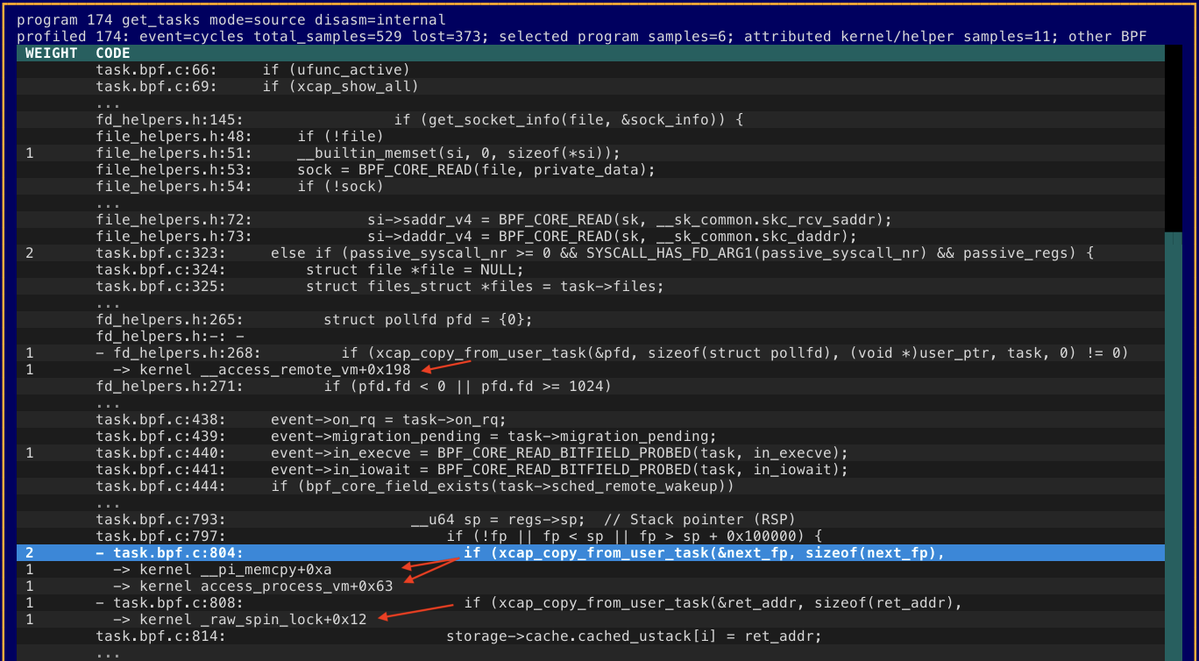
Releasing an eBPF Runtime Reporter and Profiler tool (brr).
I've used it for profiling eBPF programs themselves.
It unifies bpftop-like utilization/event frequency monitoring with perf_events based CPU sampling, with source code line mapping.
https://t.co/LiXp3zGA7q
For io_uring nerds...
uringscope: eBPF tracer and analyzer for io_uring. Reconstructs per-request latency, io-wq punts, and batching from kernel tracepoints, then names the problem and suggests a fix.
https://t.co/hzXyjbu3ov
For io_uring nerds...
uringscope: eBPF tracer and analyzer for io_uring. Reconstructs per-request latency, io-wq punts, and batching from kernel tracepoints, then names the problem and suggests a fix.
https://t.co/hzXyjbu3ov
Our last group of #P99CONF breakouts starts in 15 minutes. Come join:
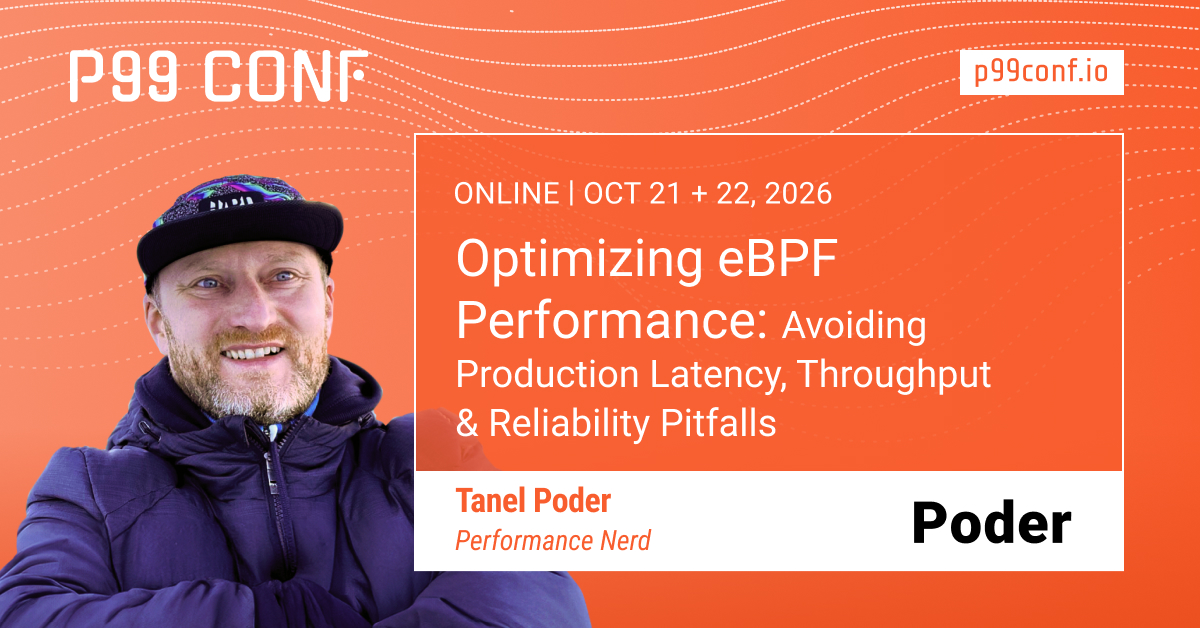
- @TanelPoder: Optimizing eBPF Performance
- AWS's Raluca Constantin: Low Latency at Global Scale
- @ScyllaDB's Pavel Emelyanov: My Fair Shares
Come join them for free here: https://t.co/UujyFnCkeq
#ScyllaDB
(1/2) eBPF is used to safely and efficiently extend the capabilities of the kernel without requiring a change in the source code or load kernel modules. It's always been a popular #P99CONF subject, and this year is no exception.
(2/2) Join us virtually on October 21-22 to hear the latest from @TanelPoder, Enzo Venturi, Hayden Stainsby, Ershaad Basheer, and @PeterZaitsev > https://t.co/BBAtapde7c
#P99CONF
There are times when #eBPF has introduced latency, reduced throughput, consumed memory, destabilized applications or caused crashes. @TanelPoder explains why this happens, how to recognize it, and techniques for avoiding it at @P99CONF. https://t.co/6vXPTF71rj
#ScyllaDB#P99CONF
eBPF and #P99CONF go together like peanut butter and jelly. What are the latest advances for this kernel technology? Find out from @TanelPoder, Enzo Venturi, Hayden Stainsby, Ershaad Basheer, @PeterZaitsev, and more at our free virtual event. https://t.co/nIH2UVtjmm
#ScyllaDB
I've been following a lot of the wal-on-s3 and database-on-s3 debates... and I think everyone is wrong 🤣
First. All the hand-wringing about whether it counts as database-on-s3 if there are cache layers above it. Guys, DBs for the last 40 years had cache layers above an extremely slow storage layer.
You think S3 is slow? Try a Netapp device with RAID-5 when the DB has a completely over-subscribed top-of-rack switch. Try a high performance Symmetrix, with a dedicated storage network, with a massively undersized Barracuda switch that basically tips over whenever someone takes a backup. Databases were designed for slow storage, and caches are the way to go. Even with NVMes, caches rock the world. I don't understand why suddenly this is a topic for debate.
Second. Getting this to work reliably is not trivial.
You can vibe-code it... If you have 20 years experience building distributed data systems, and you know every algorithm and how well they worked in production and how to comprehensively test them. Then you can guide your LLM toward a great outcome.
But if it is your first time building a distributed system (or any kind of data store), you should see this as a learning experience - and embrace the lessons that are facing you. As many people discovered in the last week - learning in public is a great way to learn, but is not for the faint of heart.
But learning *is* the important bit. Which is why I'm sharing my 2 bits - so everyone can yell at me and I can learn too!
To get you ready for @TanelPoder's 2026 #P99CONF talk, check out his 2025 session where he shared the prod/GA ready version of xCapture v3 + xtop and demonstrated how it helps with real life troubleshooting scenarios. Watch for free here: https://t.co/XYqI13bvQd
#ScyllaDB
What are proven ways to optimize eBPF? @TanelPoder will share the trade-offs and help #eBPF build observability systems that remain trustworthy under production workloads. Don't miss this highly technical session at @P99CONF. https://t.co/4raHQKZS20
#ScyllaDB#P99CONF
@P99CONF This should be (again) useful and fun!
In addition to other things, I'll demo my new "brr" eBPF Runtime Reporter and Profiler tool that uses perf_events for profiling both the eBPF program functions and OS kernel function calls underneath 😎
https://t.co/Exd8H1NiNA
How can you avoid production latency, throughput, and reliability pitfalls? #P99CONF veteran @tanelpoder will help practitioners understand the trade-offs and build observability systems that remain trustworthy under production workloads. https://t.co/nKtKDfApTr
#ScyllaDB#ePBF
@ObiwanC64@0xtools There's a "bcc-profile" tool in bcc-tools toolkit, also for tracing (not just profiling/sampling) userspace stuff with uprobes or USDTs, there's a good detailed article series by Oracle about it:
https://t.co/yoV2Kh6NId
Releasing an eBPF Runtime Reporter and Profiler tool (brr).
I've used it for profiling eBPF programs themselves.
It unifies bpftop-like utilization/event frequency monitoring with perf_events based CPU sampling, with source code line mapping.
https://t.co/LiXp3zGA7q
@ObiwanC64 If you just want to sample stack traces, then even good old "perf" will do the trick. But eBPF can both sample userland stacks and place uprobes for tracing them.
If there are no framepointers in the compiled app, then you'd need an unwinder (I use Meta BlazeSym for @0xtools)