The ratio between tech stocks and the S&P 500 is now over 2 standard deviations ABOVE its historical mean.
Even during the Dot-com bubble of the late 1990s’, this metric peaked at 1.6 standard deviations.
Since 2008, tech stocks have consistently outperformed the S&P 500.
During this time, the Nasdaq Composite and the S&P 500 returned 1,167% and 667%, respectively.
With the mergence of AI, US markets are now almost entirely driven by tech stocks.
Are we overdue for a correction?
The #liquidity#index has also stalled recently even as the #market continued to accelerate higher. The last time there was a gap of this magnitude, the market corrected 10% last summer.
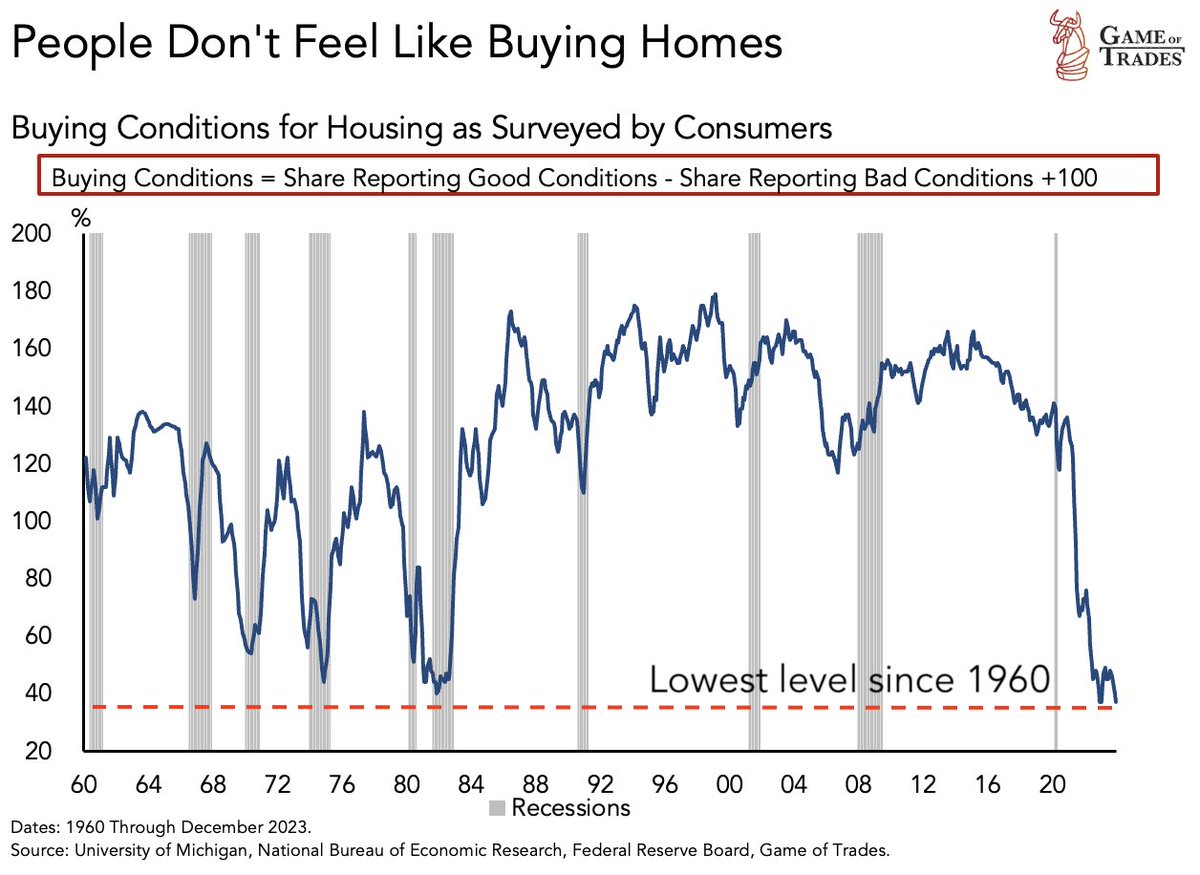
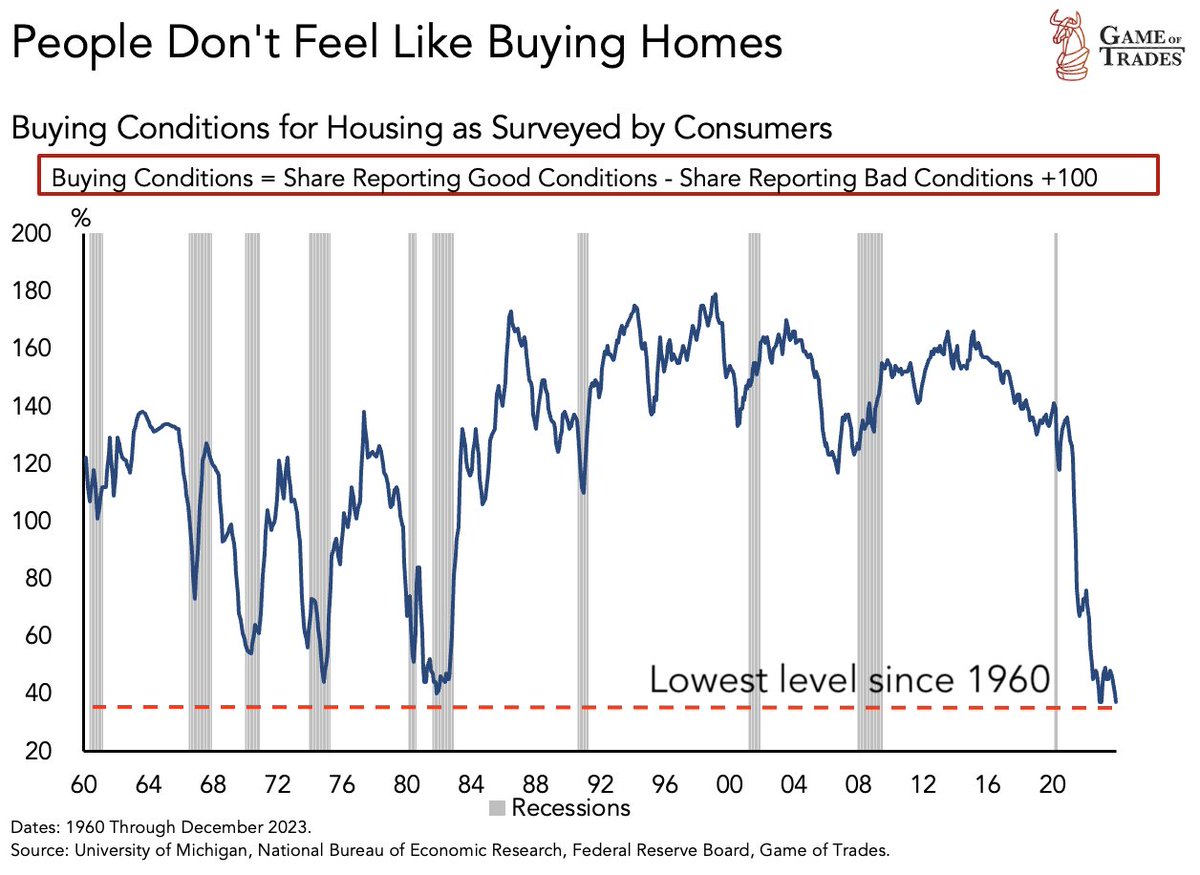
Buying conditions in the housing market have collapsed
Reaching levels NEVER seen since 1960
Even the 30-year mortgage rate recently hit levels not seen in 2 decades
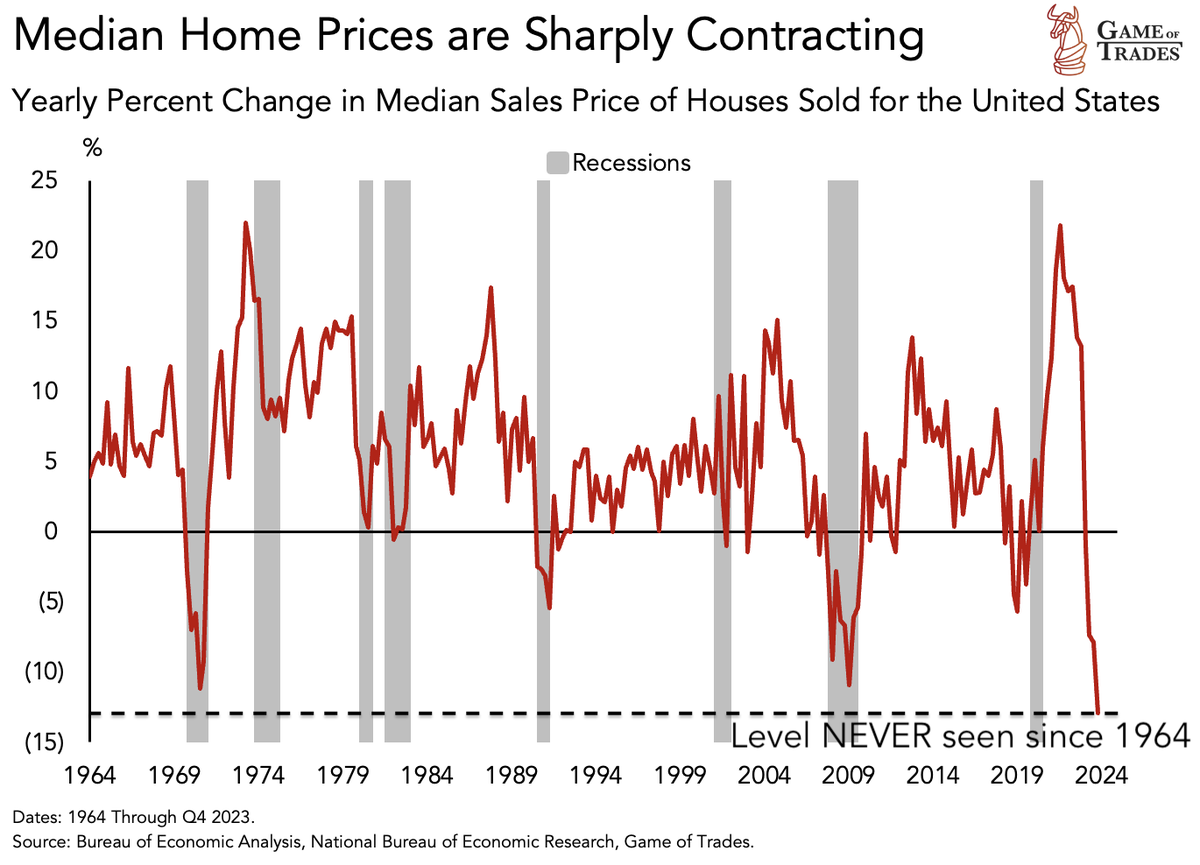
This is critical because the housing market is a leading indicator of the business cycle
And it tends to react quickly to changes in interest rates
We like to use quantitative analysis to gain insights from various indicators and evaluate the business cycle to position accordingly
Check our Forecast Models on key assets at https://t.co/4gTCgwAqcy
BREAKING: The S&P 500 has hit a record 5180 and is now up an incredible 26% in just 4 months.
Since the October 2023 low, the S&P 500 has added nearly 1,100 points.
In just 88 trading days, the S&P 500 has added $9 TRILLION in market cap.
That's an average of $102 billion per trading day for 88 days straight.
Since the March 2020 pandemic low, the S&P 500 is up 137%.
History in the making.
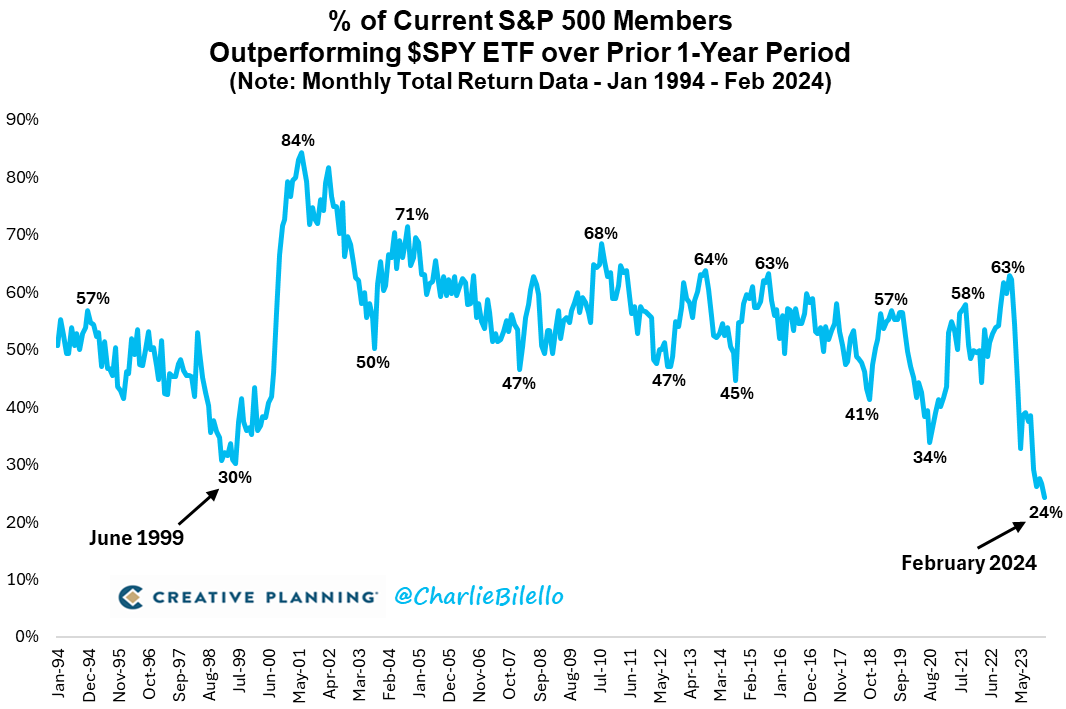
Only 24% of S&P 500 members outperformed the index over the last year, the lowest % on record w/ data going back to 1994.
Video: https://t.co/cd3ibVwLpx
Nvidia, $NVDA, the 3rd biggest company in the world, just fell 10% in 30 minutes.
That's a company with $2.3 trillion in market cap trading like a penny stock.
Is it weird that this feels completely normal now?
1/3
Here's an update on the concentration of the stock market:
This table and chart show that the ENTIRE gain in the NASDAQ 100 (NDX), which the ETF QQQ tracks, is just four stocks. Collectively, the "other 96" are down on the year.
Year-to-date, the "Fabulous Four" have increased the NDX total market capitalization by 9.16% (blue). The "other 96" have dragged it 0.50% lower (brown).
(Note that NVDA's market cap has increased by $1 trillion in nine weeks!)
Full-time employment is starting to roll over while part-time payrolls are rising substantially, reminiscent of prior recessionary periods.
Although the anticipated decline in labor market conditions has been slower compared to previous cycles, there is now tangible evidence suggesting a significant deceleration in employment activity.
The Fed is trapped and gold is sniffing this all week.
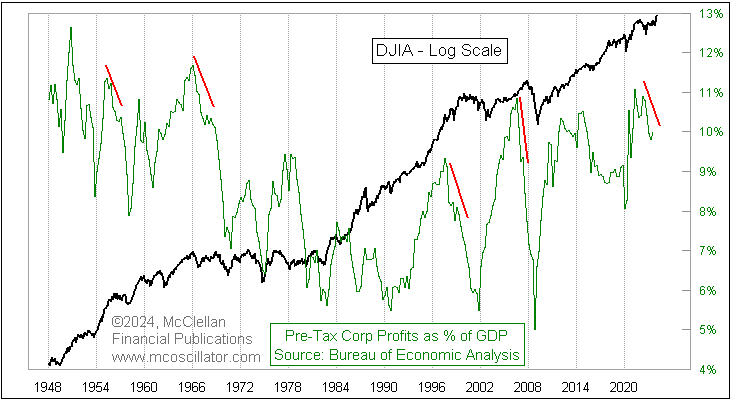
Pre-tax corp. profits (for all US companies, not just public ones) peaked in 2Q2021. Latest data for 4Q2023 are still not out yet. Divergences versus stock prices like this current one are not bullish news, but divergences can persist for a while before they finally matter.