🚨S&P 500 – Terminal Five-Wave Advance Wrapping Up
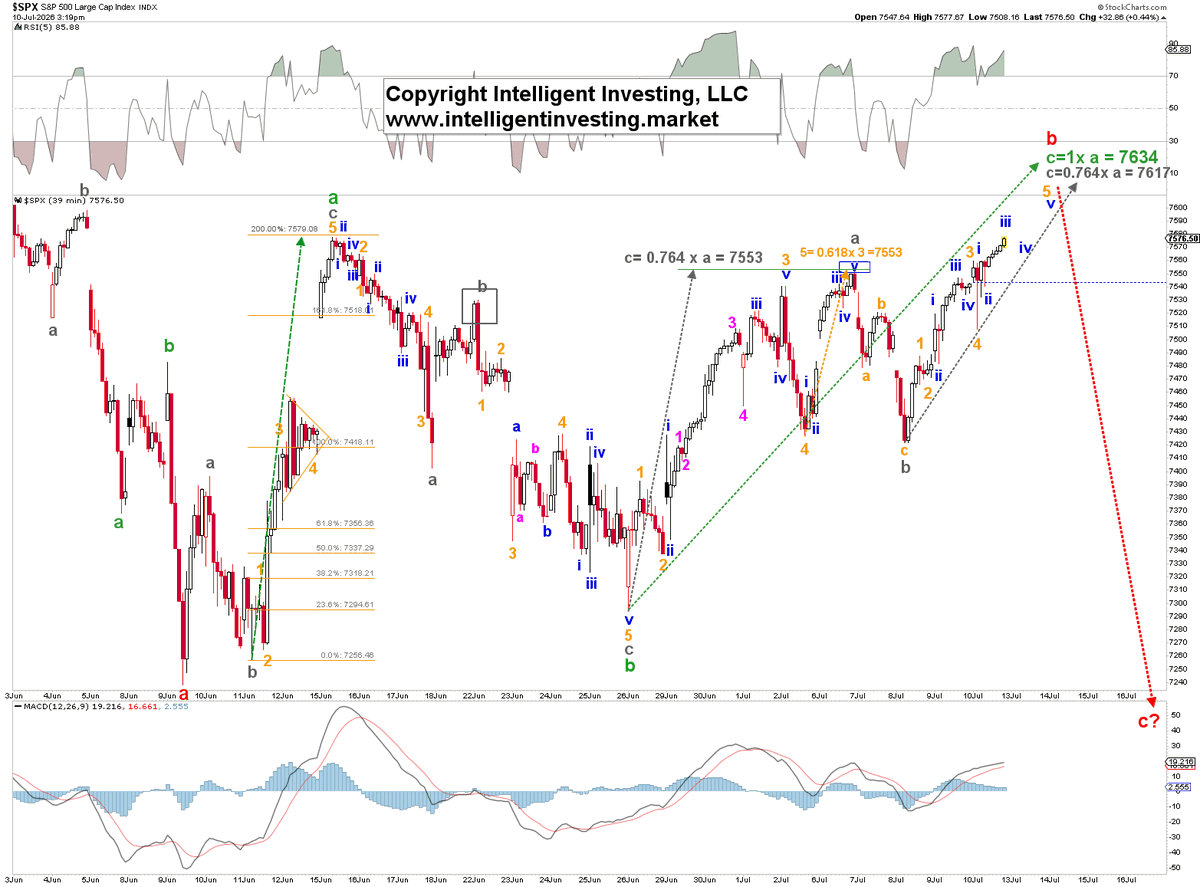
The chart is flashing a classic terminal impulse in the final c-wave of a larger Wave-b.
We’re in the last stages of this five-wave advance:
* Overlapping waves typical of a terminal structure
* Final v of 5 of c pushing into the Fibonacci targets at 7617 – 7634, possibly only ~7600...
Once this terminal wave 5 completes, the expected outcome is a sharp reversal lower — labeled red W-c?
This is the kind of pattern that often marks the end of the larger move up, not the middle.
Traders: watch for signs of exhaustion, e.g., a break of the recent swing low.
The risk/reward now heavily favors the downside after this final push.
Daily Full Elliott Wave counts for all major US indexes, Gold, Cryptos, and much more 👉 https://t.co/LBDcl0jQM3
What’s your read — topping here or one more leg?
$SPX #ElliottWave #SP500 #TechnicalAnalysis #TradingTips
What are YOU thinking???
Seriously.
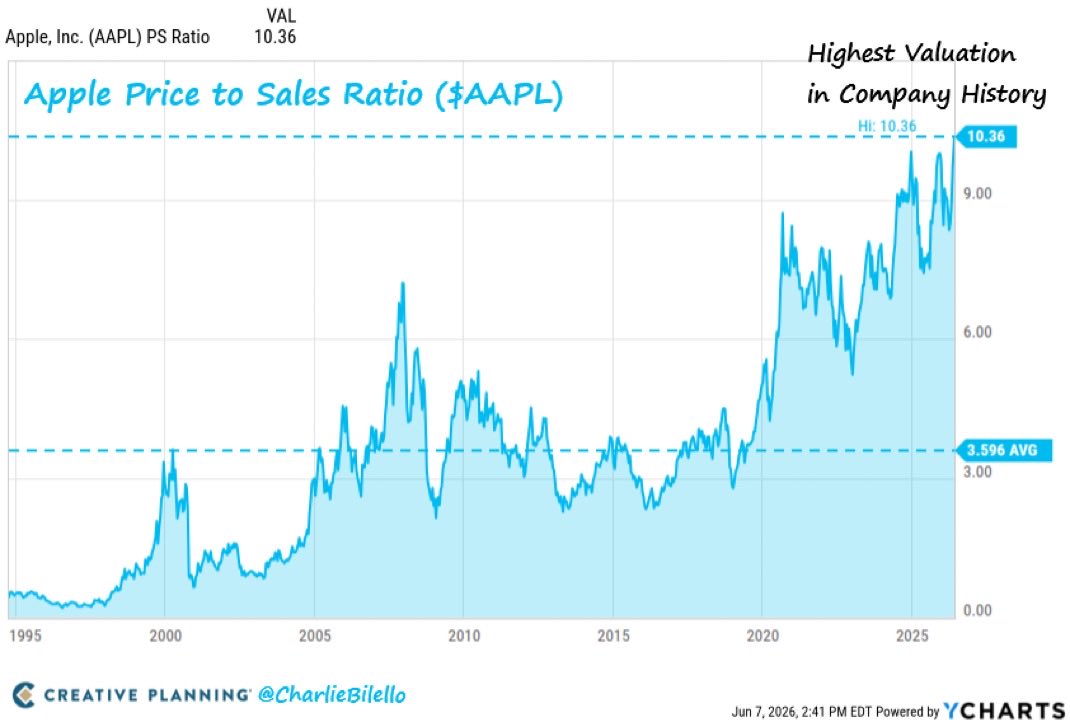
Apple trades at 10.4x sales. The highest valuation in the company's history. Higher than 2000. Higher than 2007.
Here's the part that should stop you: revenue has been roughly flat for five years. The stock kept climbing anyway. The entire move was multiple expansion. You paid more and more for the same sales.
In 2002, Sun Microsystems' CEO looked back at his own stock trading at 10x sales during the bubble. He walked through the math: at that price, he'd need to pay out every dollar of revenue for a decade, with zero costs, zero taxes, zero R&D, just to return your money.
His conclusion, addressed to the people who bought it: what were you thinking?
Sun was growing when it commanded 10x sales. Apple gets the same multiple for standing still.
And this isn't a stock you can ignore. Apple is 8% of the S&P 500. If you own an index fund, one of every twelve dollars sits in a company at record valuation with no growth to show for it.
Yesterday's post showed what happens after a stock joins the top 10: -1.5% a year for a decade. Apple is the largest of them all, at the highest price it has ever commanded.
The trophy costs 10x sales now.
What are you thinking?
Who is buying this?
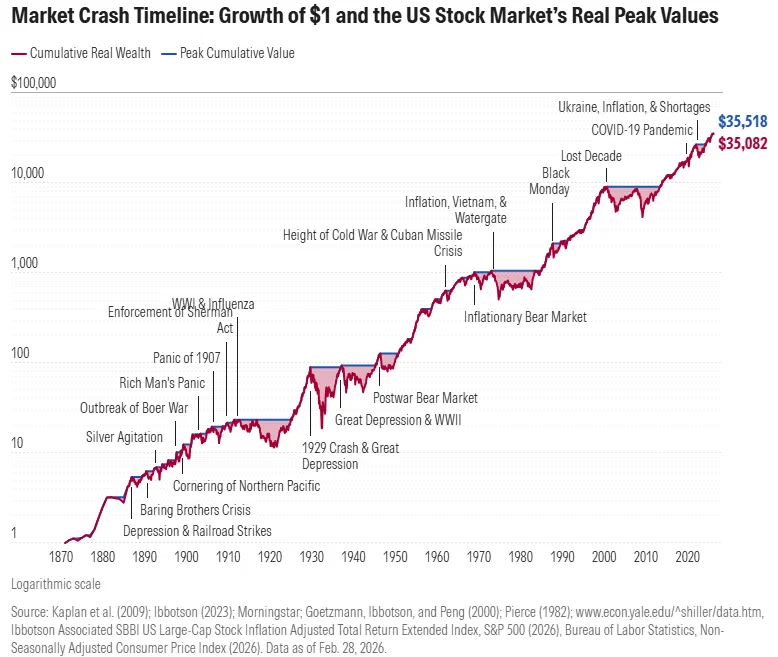
🇺🇸 This is the most persuasive chart in finance. It has also ruined more retirements than any crash on it.
One dollar invested in US stocks in 1870 is worth $35,082 today, after inflation. Every catastrophe on the timeline shrinks to a dent. The Panic of 1907. The Depression. Black Monday. All noise on a log scale.
The pitch writes itself. Hold long enough and nothing can touch you.
Now ignore the red line and look at the flat blue segments. Those are years spent underwater, waiting to reclaim a previous peak, in real terms, with dividends reinvested.
1901 to 1921: twenty years.
1929 to 1949: twenty years.
1968 to 1983: fifteen years.
2000 to 2013: thirteen years.
A working life gives you about forty investing years. This chart eats them thirteen to twenty at a time.
The market had 155 years to be right.
You get forty. And you don't get to pick which forty.
Crash protection has disappeared at the same time valuations have entered rare air.
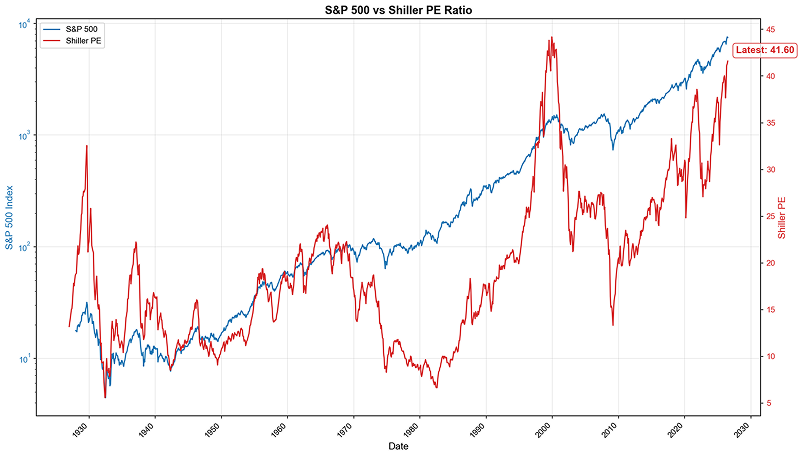
The Shiller PE is 41.60, only 5.9% below the 1999 peak. Readings above 40 have only appeared in 1999, 2000, and 2026.
BREAKING: Since the start of 2025, US jobs numbers have now been revised down in 14 out of 17 months by a total of -710,000 jobs.
May and April jobs numbers were revised down by a total of -74,000, the largest 2-month downward revision since December.
April jobs were revised down by -31,000, to +148,000, while May jobs were revised down by -43,000, to +129,000.
This means -41,765 jobs have been revised out of previously reported data, on average, in each month of this period.
If we apply this average to the +57,000 June nonfarm payrolls, it would imply just ~15,000 jobs were added last month.
Job market revisions are concerning.
Howard Schultz pitched the Starbucks idea to investors and heard "no" 242 times.
He kept the list. Every single name.
"It wasn't any risk, because I had no money. I had to go out and find investors."
"It was incredibly difficult. Almost all of them said no. 242 people said no."
"I have a fastidious list of the people I talked to, because it was the original list. A check mark, a cross out, a check mark."
"Many of them I've met over the years. They said, 'You never came to me for money.' No, actually, I did. That's a bad day for them."
What he was actually pitching:
"1,500 Italian coffee bars in Milan alone. I'm watching the ritual, the sense of community. The opportunity isn't for the home. It's in the store."
"Did we ever think we'd have 36,000 stores in 80 countries? No."
242 nos is not a rejection rate. It's a filing system.
The founders who win are the ones still pitching after the number that would make a reasonable person quit.
- Howard Schultz on Graham Bensinger's show (@grahambensinger)
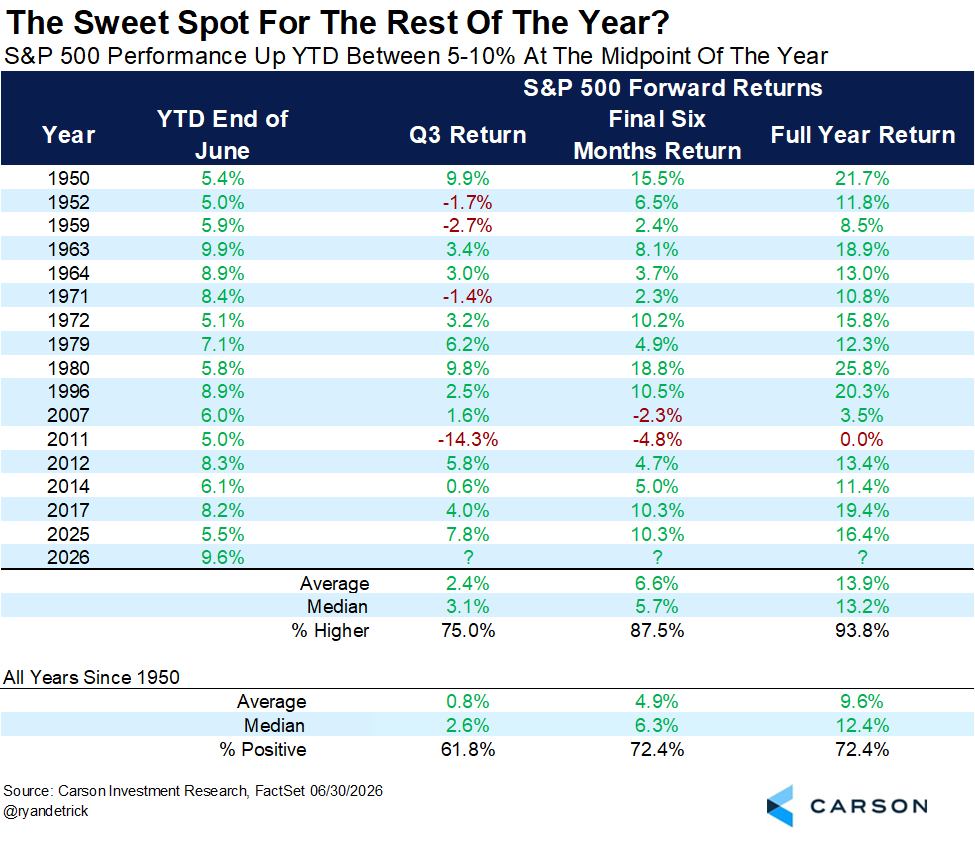
We noted this last year (and it worked), but when the S&P 500 is up between 5-10% YTD at the midpoint of the year, the rest of the year usually does quite well.
In fact, worst full year return was exactly flat in 2011, so a large decline from here would be quite rare.
So not too strong, but by no means weak. Yet another reason to continue riding the wave in 2026. 🌊🌊
What keeps me awake at night?
This.
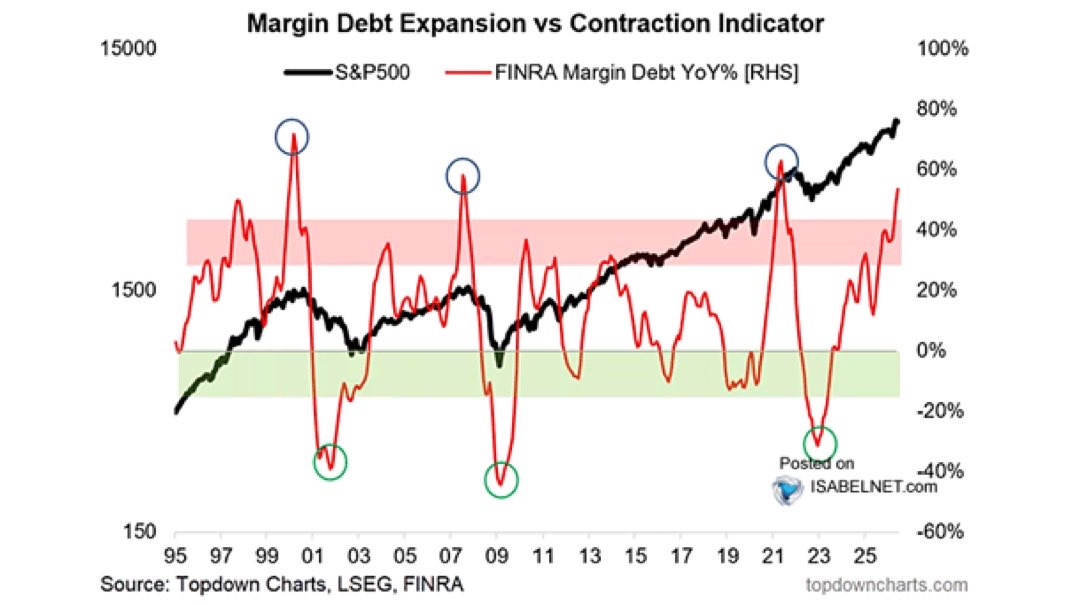
One of the oldest froth gauges on Wall Street: the year-over-year change in margin debt. How fast investors are borrowing money to buy stocks.
May 2026 reading: 53.7%. A new record high in absolute terms, $1.42 trillion borrowed against portfolios.
Look at the chart. Every blue circle is a major top. 2000. 2007. 2021. The pattern is always the same. The line climbs into the danger zone, rolls over, and the rollover is the signal. Not the peak itself. The turn down from it.
That's the part most people get wrong. They wait for a number. A line in the sand at 55%, or 60%, or wherever. But the market doesn't ring a bell at a level. The tell is direction.
While margin debt is rising, leverage is being added. Genius on the way up. It amplifies every gain and makes the bulls look like prophets.
When it turns down, the machine runs in reverse. Borrowed money gets called back. A normal 10% dip triggers margin calls. Forced selling begets forced selling. The leverage that built the top accelerates the fall.
So here's what I'm watching now. Not whether we hit a magic number. Whether this line stops climbing and starts to fall.
The peak in margin debt growth has marked the edge of every major top for two generations. We're sitting at the second-highest reading in years, still rising.
The day it rolls over is the day to pay attention.
Up is the party. Down is the bill.
to celebrate hitting 20k followers i'm giving away 5 @Tradeify 150k lightning funded accounts 🤍
that's over $2,500 in INSTANT funded accounts - a HUGE giveaway. Tradeify knows how to do it best :))
to enter:
- follow me + @Tradeify
- like + repost
- reply "AW"
winners in 6 days.
i couldn't be more thankful for all of you along the way to 20k🫶
Today is the day bulls start celebrating. The S&P 500 's 12-day mid-year rally window begins today.
Since 2010, this period has been negative just once. Going back to 1950, $SPX has gained a median of 1.5% during this stretch, with a 74% positivity rate
A separate breadth divergence signal just fired too.
Near 252-day highs, the S&P 500 was higher one month later only 16% of the time.
The siren has company.
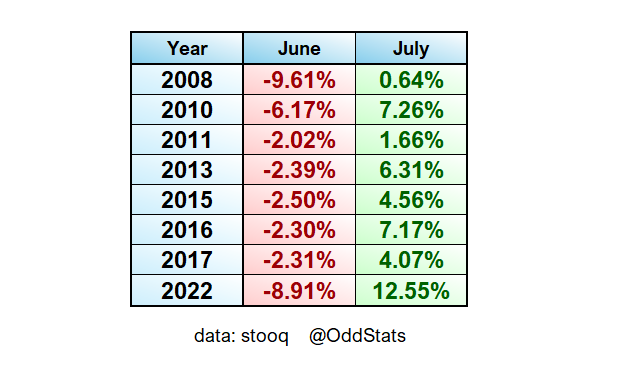
We are almost done with the seasonal June sell off. After tomorrow's close, the S&P 500 will enter one of its strongest 12-day mid-year rally period.
During this stretch, $SPX has been negative only once over the past 15 years. $SPY