3) Two historical overlays of interest to me are:
1) Trump's 1st term (blue) which had been playing out extremely well
2) 2021-22 dollar rally due to M2 expansion, inflation, oil spike during Russia-Ukraine war (blue):
If buyers are not stepping in at this support of 60K, that means they want to buy it at lower levels. Still no bottom reversal chart pattern here. $BTCUSD
Gold is in a 45-year parabolic slingshot-move.
Posted on the blue breakout in linked post.
Target is $15 000 - $20 000 since many years back, and might raise it further.
Now in a much needed consolidation/pullback, which could last longer than many thinks. #joinus
That chart is not a very good way to portray the data. Too jumbled. Here is a better way. This way allows us to better see what past big differences have meant, by showing the spread and including the price comparison. And the white background means you can see the data.
How many years before the next bull market cycle in Silver? The past two averaged 22 years.
Be bold -- reply with your prediction.
The next bull market is _______X_______ years away?
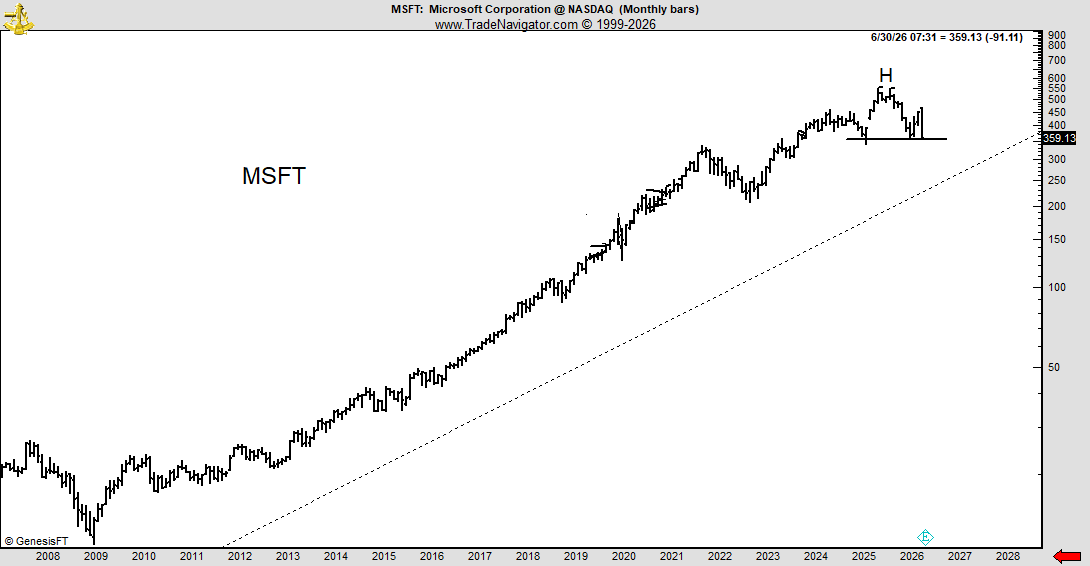
Edwards & Magee and Schabacker discussed the H&S continuation in their book.
In the new technical analysis books, this is not well covered. There is a misconception that H&S can only form as a reversal at the bottom or top.
H&S can act as a continuation chart pattern as well.
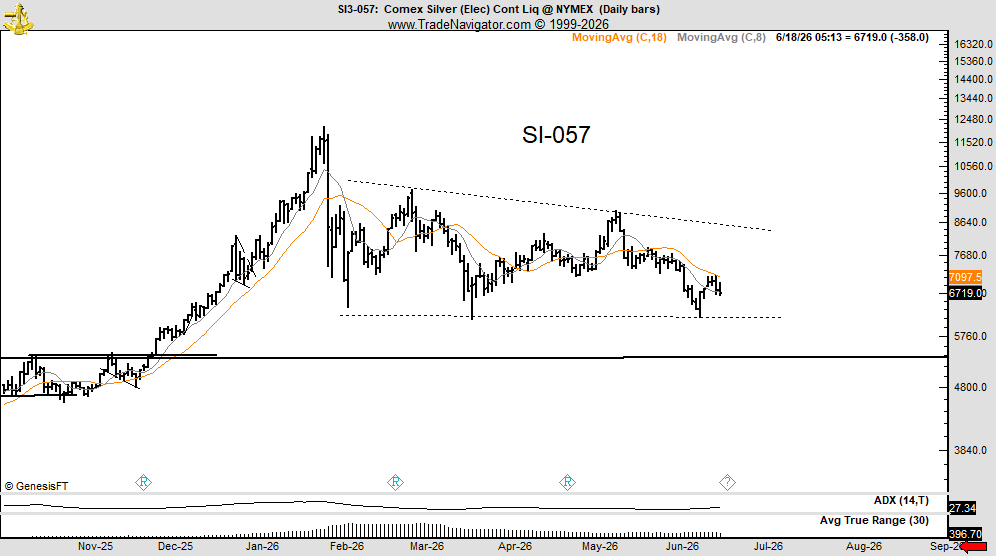
The small "non-reportable" traders of silver futures have been stubbornly fighting the downtrend since the Jan. 2026 peak. But last week's COT Report data showed that these small traders are finally starting to break. Key point to note: These traders are almost always net long as a group, but to varying degrees.
Hostile group of Microsoft $MSFT are suing the company about the Nov - Mar market decline
What are they going to do if this is a real H&S top that results in a decline to at least $229?
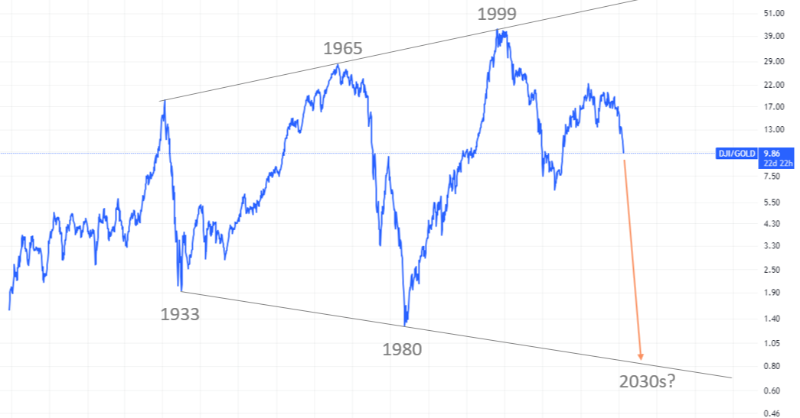
Could Dow/Gold Ratio Fall Below 1.0? What's next for the Dow Jones?
My 2026 Outlook shows exactly when the party ends. → FREE 60-page eBook (normally $30)
Two things are required for a "possible" pattern to become a "realized" pattern
1. Completion
2. A run to the target
If descending triangle below is realized, Silver could trade again in the low $40's/high $30's $SI_F