Select your cell: I'm prototyping an interactive sc RNA-seq portal where the UMAP is dynamically linked to morphing 3D artistic renders of each cell type. You can play with the initial build below.
Paper2Code
PaperCoder is a multi-agent LLM system that transforms a paper into code repository.
It follows a three-stage pipeline: planning, analysis, and code generation, each handled by specialized agents.
100% open-source.
Our #bionformatics#Rstats method CRAWDAD (Cell-type Relationship Analysis Workflow Done Across Distances) for quantifying cell-type spatial relationships in #singlecell#spatialomics data is now published! https://t.co/Ij7uuWU3BY
Congrats to the team 🥳🥂 #AcademicTwitter
Biggest medical discoveries of the week (🧵)
1/8
In a world first, induced pluripotent stem cells restored vision in 3 patients with limbal stem-cell deficiency (LSCD)
LSCD is loss of the stem cells that replenish the cornea, and can be caused by trauma, autoimmunity or genetics
In this trial, blood cells from donors were induced to pluripotent stem cells, cultured to form a sheet of corneal cells, and transplanted into recipients
This was a small trial, with no serious adverse events (including no rejection) after 2 years of follow up - a bigger trial is underway
(Study: https://t.co/wE5ezb0rVA)
We think that all memory is stored in the brain. But our study published today in @NatureComms shows that all cells—even kidney cells—can count, detect patterns, store memories, and do so similarly to brain cells. My first (co)corresponding author paper!🧵https://t.co/biaahYiPRW
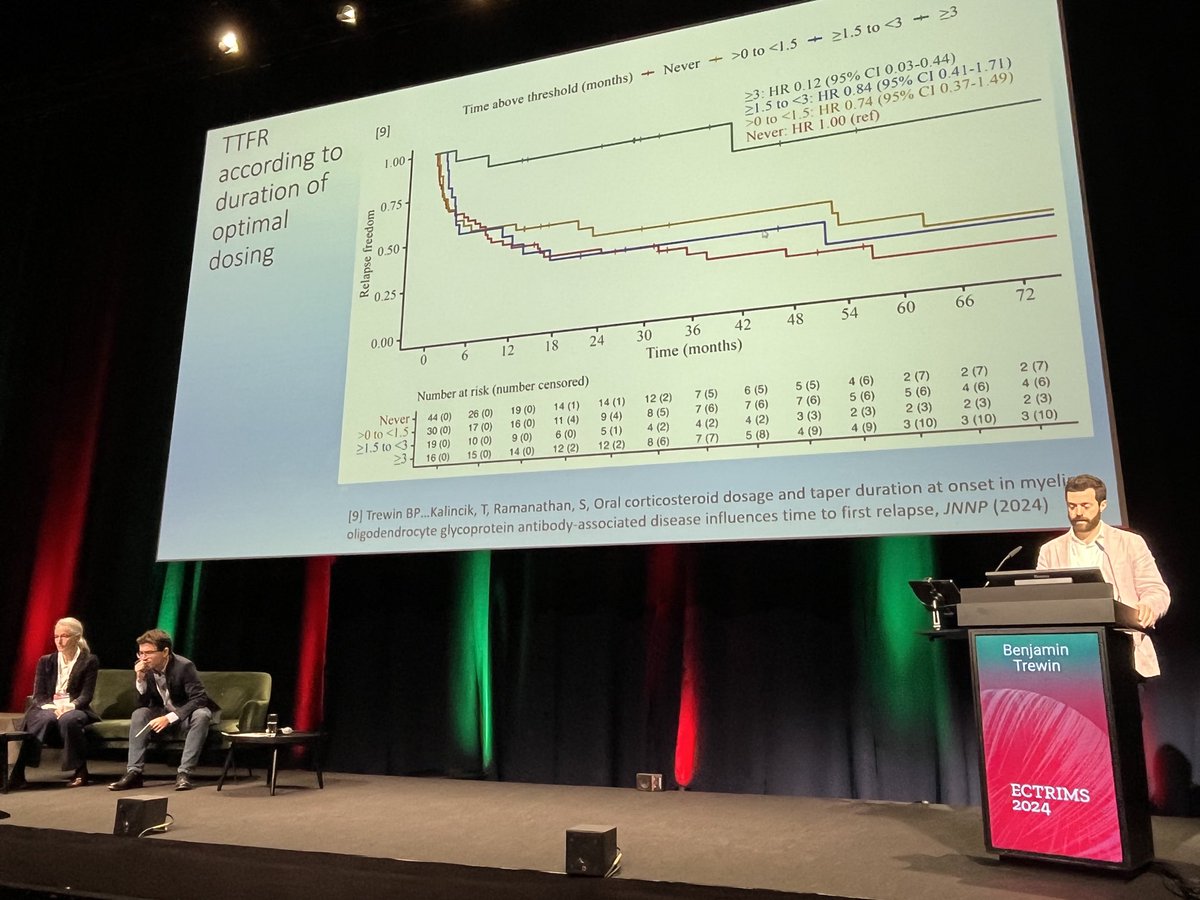
Fantastic presentation from @Benjamin_Trewin regarding his data on optimal therapeutic dosing of corticosteroids at #MOGAD onset delaying time to first relapse @ECTRIMS. Great audience discussions @syd_health @kids_research
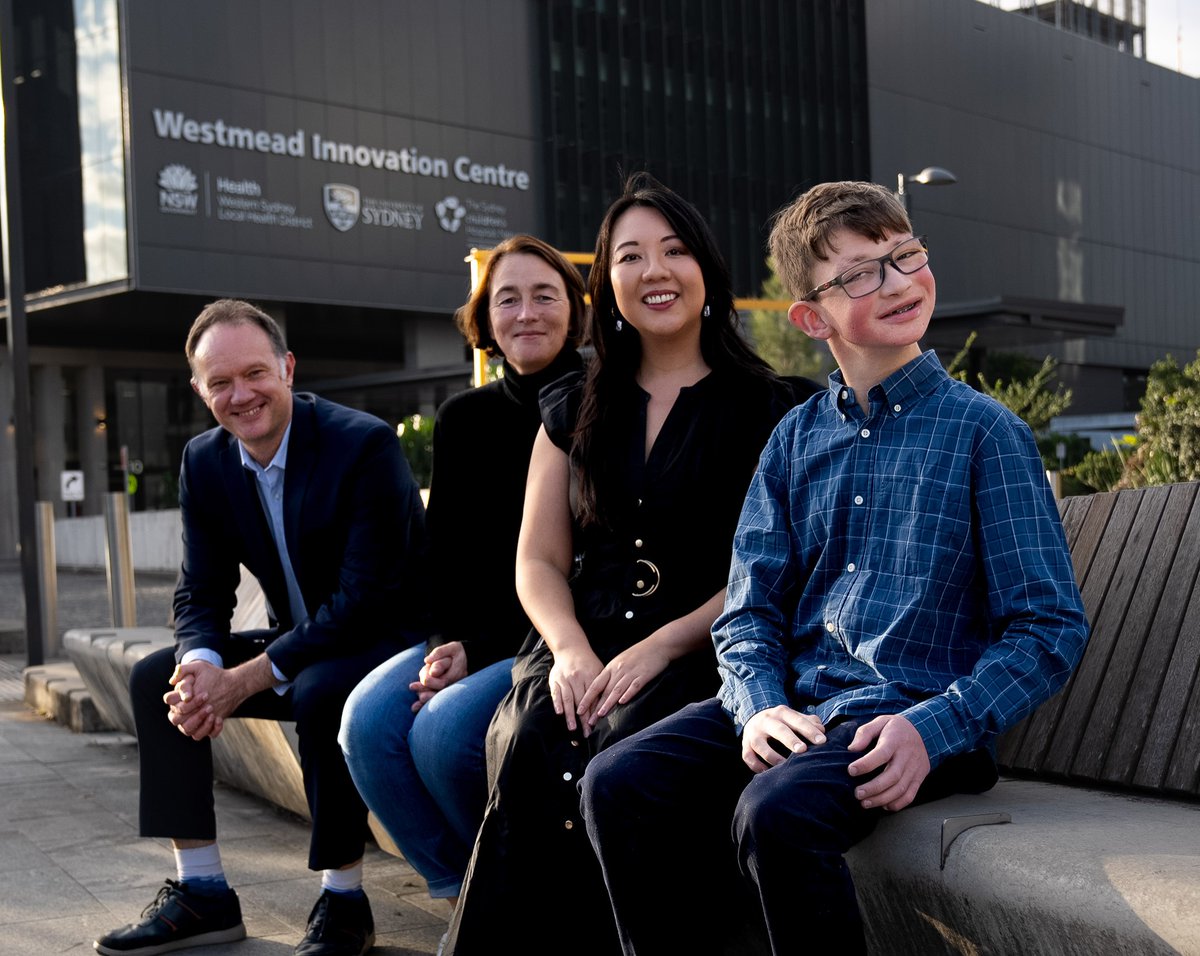
Reflecting on an amazing time @ISSCR in Hamburg! It was truly inspiring to delve into cutting-edge science & connect with colleagues from around the world.
Honoured to have presented my research at this international conference 🧠
#ISSCR2024@kids_research@Sydney_Uni@SCHNkids
🌏A world-first study has shown a ketogenic diet 🥑could have a life-changing impact on cognitive function for children like Hugo living with Kabuki syndrome📋
Read more➡️https://t.co/ufUbPdGGQr
@CMRI_AUS@WestmeadInst@Sydney_Uni@schf_kids
COVID-19 will never be like the Flu. Never.
At least not for the brain.
I would love to be wrong; please prove me wrong with evidence and real science!
It is quite simple. #SARSCoV2 can access the brain using several different mechanisms that Influenza cannot.
A: Viral infection of peripheral nerves (like olfactory bulb)
B: Damage of infected endothelial cells
C: Hijacking immune cells
D: Viral opening of tight junctions
Some studies show that some flu strains can use one or other mechanisms, and brain invasion can happen, but it is a weaker and rarer event. The same is true for other viruses.
I have spent hundreds of hours in the microscope looking at the worst viruses can do to the brain, including the Zika virus, HIV, Flu, and others. I've never seen the type of damage SARS-CoV-2 leaves behind after infection with other viruses.
I cannot comment on what happens in other organs, but #LongCovid can be caused by brain damage. It exists and is real.
👉 Machine Learning Pipeline
An in-depth machine learning tutorial introducing readers to a whole machine learning pipeline from scratch by @Harvard
🔗 https://t.co/jaPFEEJKNA
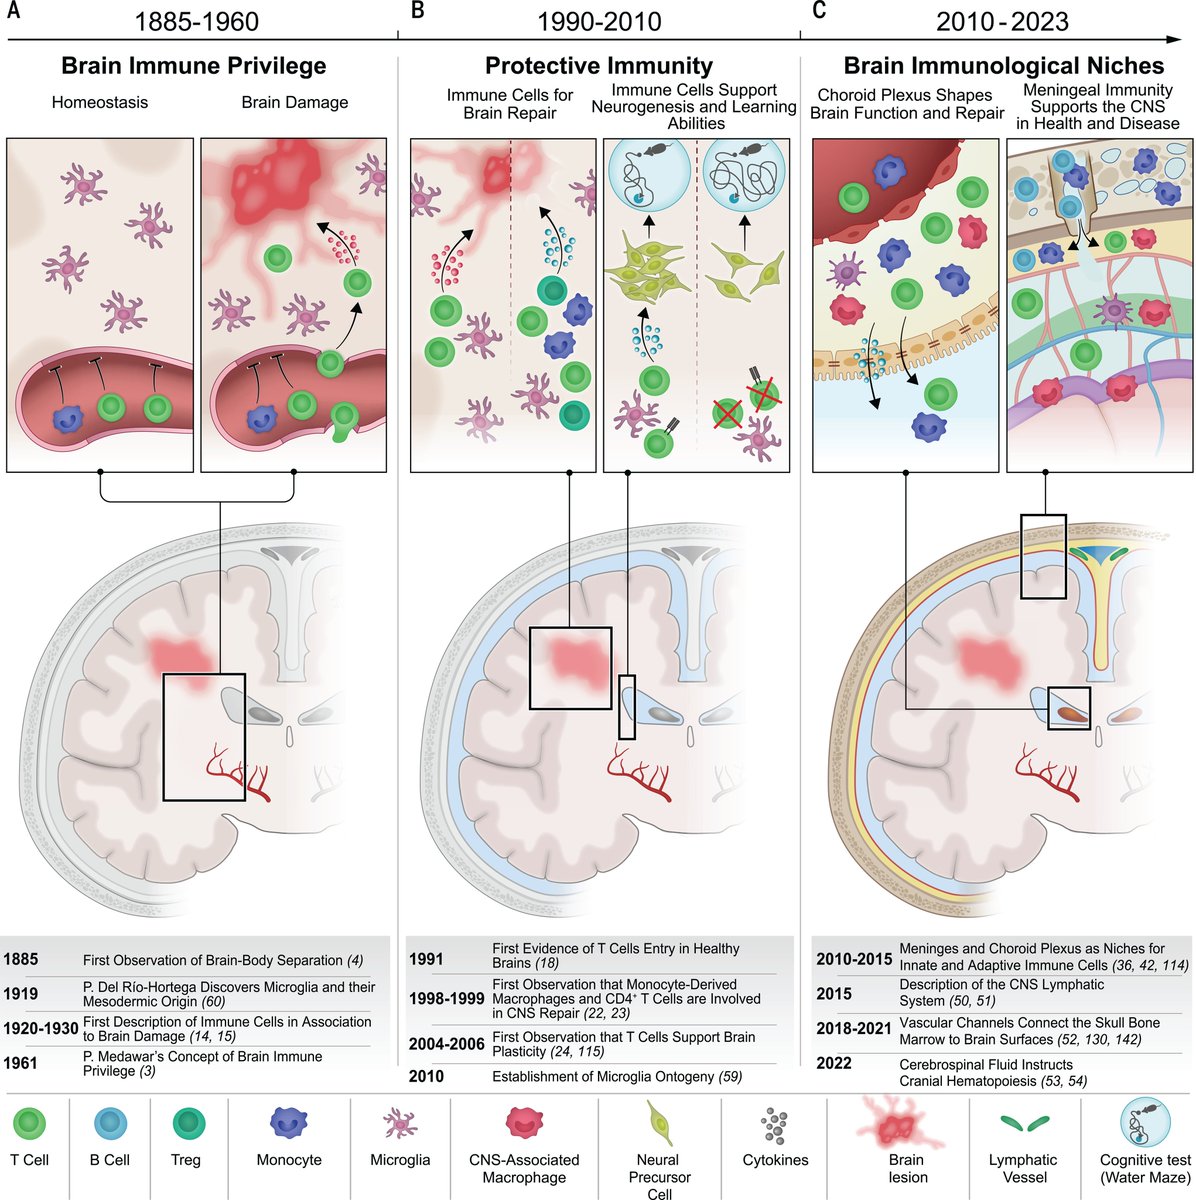
Our understanding of how the brain and immune system interact has changed substantially over the past years and decades.
A #ScienceReview takes a look at recent discoveries that are transforming our understanding of brain immunity: https://t.co/pczz7m8nX8
K-means is an essential algorithm for Data Science and Business. In 4 minutes learn what took me 4 weeks to figure out. Let's dive in.
1. K-means is a popular unsupervised machine learning algorithm used for clustering. It's a core algorithm used for customer segmentation, inventory categorization, market segmentation, and even anomaly detection.
2. Unsupervised: K-means is an unsupervised algorithm that is used on data with no labels or predefined outcomes. The goal is not to predict a target output, but to explore the structure of the data by identifying patterns, clusters, or relationships within the dataset.
3. Objective Function: The objective of K-means is to minimize the within-cluster sum of squares (WCSS). It does this though a series of iterative steps that include Assignments and Updated Steps.
4. Assignment Step: In this step, each data point is assigned to the nearest cluster centroid. The "nearest" is typically determined using the Euclidean distance.
5. Update Step: Recalculate the centroids as the mean of all points in the cluster. Each centroid is the average of the points in its cluster.
6. Iterate: The assignment and update steps are repeated until the centroids no longer change significantly, indicating that the clusters are as good as stable. This process minimizes the within-cluster variance.
7. Key outputs: Cluster Centroids, Labels, and the Sum of Squared Distances. The centroids represent the mean location of all points in each cluster and are essential for interpreting the results of the clustering. The Labels are the cluster assignments. The Sum of Squared Distances is a measure of the distance that each point in the cluster is from the cluster centroid.
8. Evaluation. There are several ways to evaluate K-Means. 2 common methods are Silhouette Score and the Elbow Method.
9. Silhouette Score: This metric measures how similar a data point is to its own cluster compared to other clusters. The silhouette score ranges from -1 to 1, where a high value indicates that the data point is well-matched to its own cluster and poorly matched to neighboring clusters.
10. Elbow Method: This method involves plotting the inertia as a function of the number of clusters and looking for an 'elbow' in the graph. The elbow point, where the rate of decrease sharply changes, can be a good choice for the number of clusters.
====
Ready to learn Data Science for Business?
I put together a free on-demand workshop that covers the 10 skills that helped me make the transition to Data Scientist: https://t.co/LR39RJ5XKB
And if you'd like to speed it up, I have a live workshop next week where I'll share how to use ChatGPT for Data Science: https://t.co/EaMpKrJiqX
#TeamMassSpec - My undergrads have created some tutorials for learning mass spec from a computational point of view (not a chemistry point of view). If you're looking for some #FridayFun, take a look and let me know what you think.
https://t.co/K7jO8l8eZd
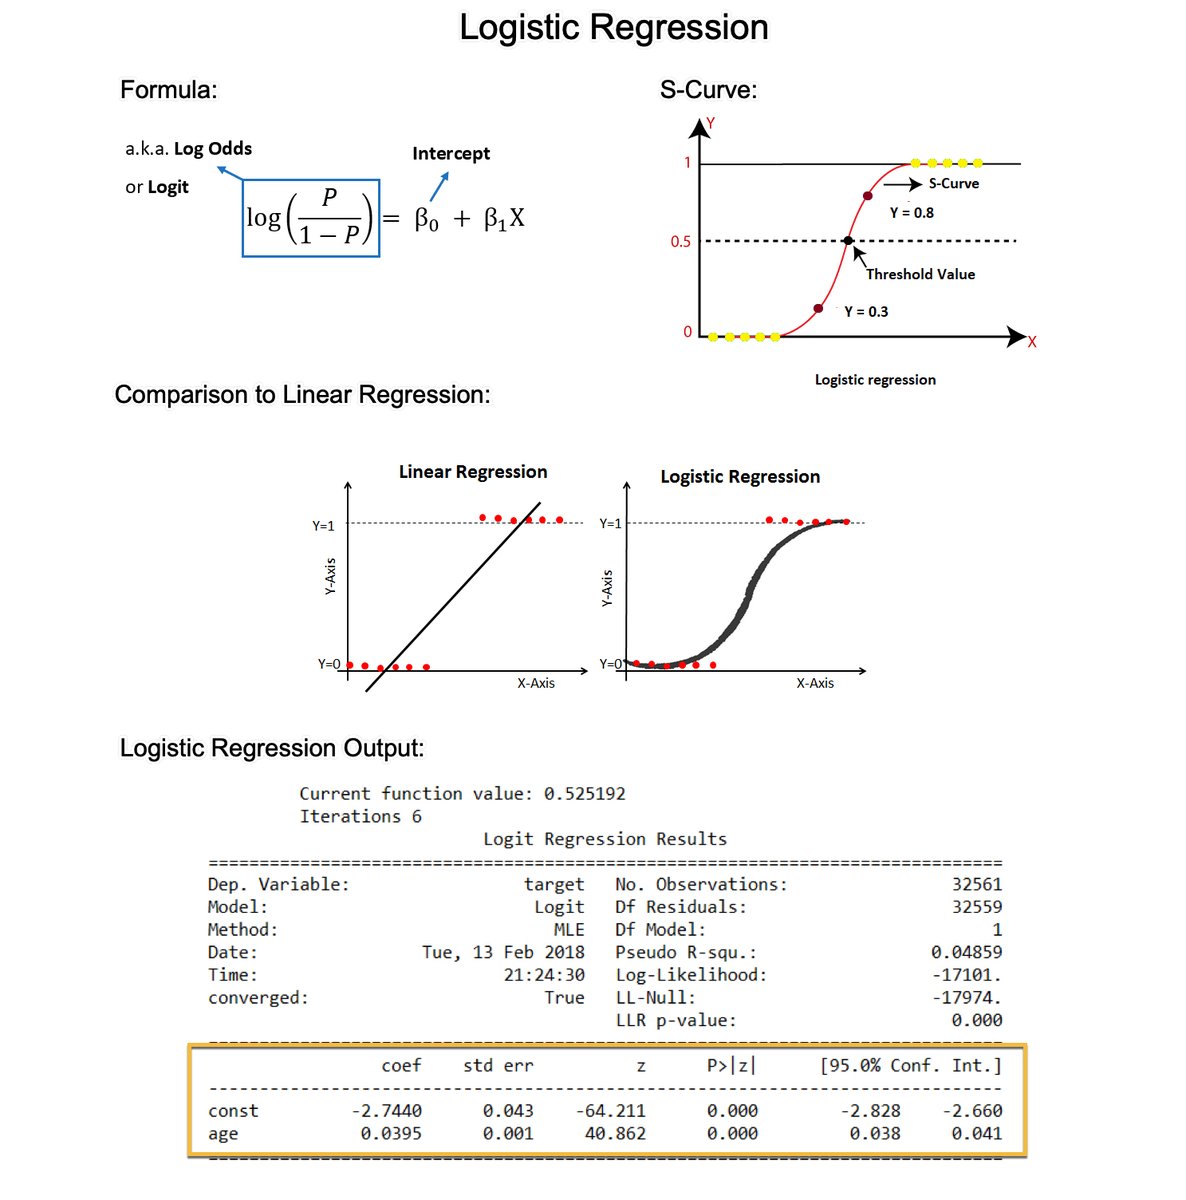
Logistic Regression is the most important foundational algorithm in Classification Modeling. In 2 minutes, I'll teach you what took me 2 months to learn. Let's dive in:
1. Logistic regression is a statistical method used for analyzing a dataset in which there are one or more independent variables that determine a binary outcome (in which there are only two possible outcomes). This is commonly called a binary classification problem.
2. The Logit (Log-Odds): The formula estimates the log-odds or logit. The right-hand side is the same as the form for linear regression. But the left-hand side is the logit function, which is the natural log of the odds ratio. The logit function is what distinguishes logistic regression from other types of regression.
3. The S-Curve: Logistic regression uses a sigmoid (or logistic) function to model the data. This function maps any real-valued number into a value between 0 and 1, making it suitable for a probability estimation. This is where the S-curve shape comes in.
4. Why not Linear Regression? The shape of the S-curve often fits the binary outcome better than a linear regression. Linear regression assumes the relationship is linear, which often does not hold for binary outcomes, where the relationship between the independent variables and the probability of the outcome is typically not linear but sigmoidal (S-shaped).
5. Coefficient Estimation: Like linear regression, logistic regression calculates coefficients for each independent variable. However, these coefficients are in the log-odds scale.
6. Coefficient Interpretation (Log-Odds to Odds): Exponentiating a coefficient converts it from log odds to odds. For example, if a coefficient is 0.5, the odds ratio is exp(0.5), which is approximately 1.65. This means that with a one-unit increase in the predictor, the odds of the outcome increase by a factor of 1.65.
7. Model evaluation: The evaluation metrics for linear regression (like R-squared) are not suitable for assessing the performance of a model in a classification context. For Logistic regression, I normally use classification-specific evaluation metrics like AUC, precision, recall, F1 score, ROC curve, etc.
===
Ready to learn Data Science for Business?
I put together a free on-demand workshop that covers the 10 skills that helped me make the transition to Data Scientist: https://t.co/LR39RJ5XKB
And if you'd like to speed it up, I have a live workshop next week where I'll share how to use ChatGPT for Data Science: https://t.co/EaMpKrJiqX