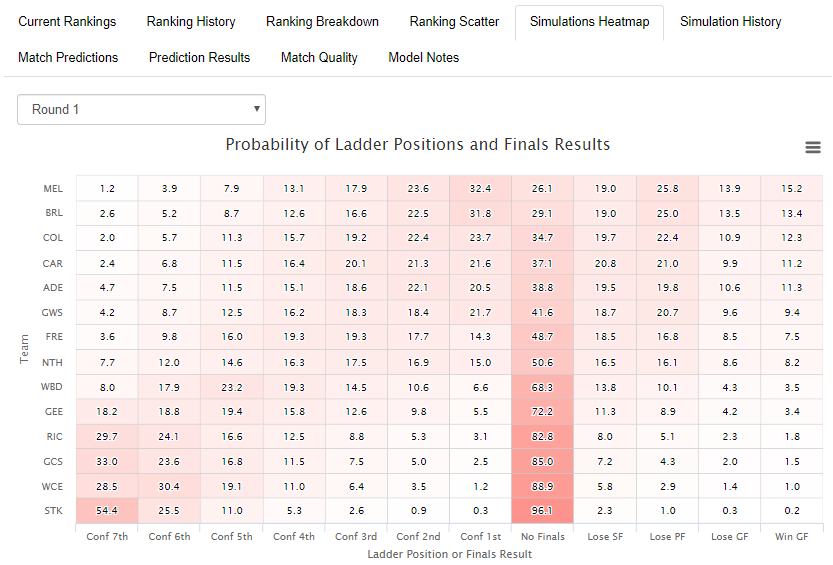
Redoing my dashboards for this season and just got my AFLW one going. Click here for predictions and charts!
https://t.co/LLPeBrhLJf
Some explanations in this thread...
@gavster2 Thanks! The Squiggle predictions are from the SCELOP model (P at the end to indicate players are considered). If you select that model in the drop down they'll be consistent.
Redoing my dashboards for this season and just got my AFLW one going. Click here for predictions and charts!
https://t.co/LLPeBrhLJf
Some explanations in this thread...
@insightlane Using the surprise metric (measuring how big of a comeback was made in win probability terms), round 13 2021 ranks as the highest ever! On average it was like every winner came back from having a 17% chance of winning at their worst point in the match
@insightlane Round 13 2021 was the most exciting round since round 12 2021!
However you have to go back to round 5 2011 to find a more exciting round than these two, good pickup! Here's top 20 H&A rounds ranked by average match excitement since 2001.
@Adrian9Johnson6@insightlane It measures the total change in win probability across the match. High scoring close matches rank highly, whereas strong favourites blowing a team away and sealing a match in the first quarter score low.
@MatterOfStats I'd consider all random pre match and most random post match. #2 sticks out; a 2:1 free kick count could be close to expectations (not random) given poor execution/discipline by one team and good umpiring on the day. If only we had a way to calculate expected free kicks!
@MatterOfStats@plusSixOneblog I think the time dependent SD should increase with time according to how much you expect ratings to change each week (a dependence on k in an ELO model). k is typically lower later in the season so a match 5 weeks away in R15 isn't as uncertain as a match 5 weeks away in R1.
@AFLLab@MatterOfStats Pretty sure there is non linearity involved, can't you model this using a non linear model of "variance added" by time from now though?
@MatterOfStats Efficiency I'd guess. Simulating 1000 distributions to pull one margin from each is surely less efficient (not sure how noticeable though) than having a more variable distribution and drawing from it 1000 times?
@thejohnholden@AflGlicko@MatterOfStats This makes sense to me, if a fav doesn't score at or above the expected rate, luck becomes a bigger factor and the result gets closer to a coin toss. This is until there isn't enough time left for variance to aid the trailing team, the result becomes more certain and prob -> 1.
@thejohnholden@AflGlicko@MatterOfStats It can move towards 50:50 if there is no scoring. Consider a team expected to win by 20pts pre match, then at different stages of the match elapsed with leads of 1 pt, using my model I get:
0% match passed: win prob 70%
75%: 62%
95%: 59%
100%: 100%
@AflGlicko@MatterOfStats@thejohnholden Yep, a team with a small lead (say 1 point) and with high expected margin can have win prob go towards 50:50 in the fourth quarter until some point where win prob will go back up towards 100
@AflGlicko@MatterOfStats@thejohnholden This answers a slightly different question, mine was assuming no scoring, just time passing. I would think most models would increase win prob after scoring unless it has some heavy weighting to scoring from kick outs late.
@MatterOfStats@thejohnholden Interesting live win probability question: Are there cases where a team can lead and win probability decreases as time passes?