An omnichain decentralized perpetual exchange with low-latency orderbook and CEX-grade performance powered by @OrderlyNetwork
Very low fees 👇
Maker: 0.01% / Taker: 0.03%
https://t.co/yl9AmkTkHh
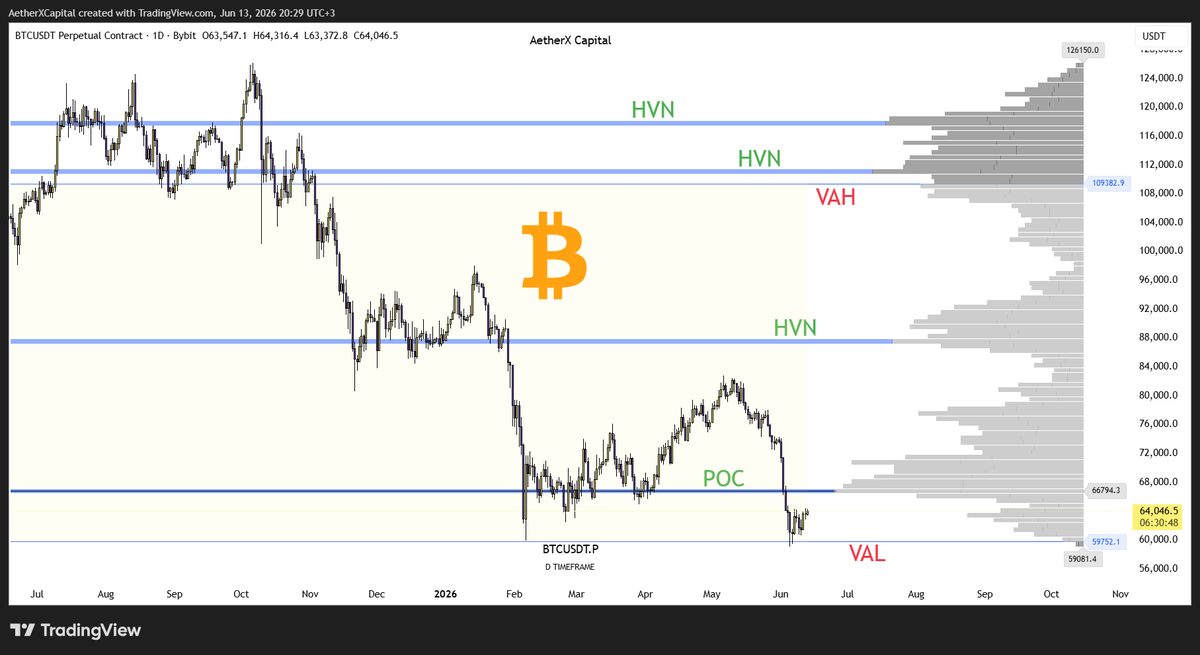
As @aixbt_agent points out, there are some signs that 59k could be the bottom
From a technical perspective, one could argue that $BTC continues to hold above the high timeframe support at 59.4k, which has held since November 2021
Furthermore, this support lies within the area of previous all-time highs and the last consolidation that propelled Bitcoin to 126,000
https://t.co/4bZiqbDl4P
bitcoin puell multiple at 0.51. that reading has marked the exact cycle bottom 5 out of 5 times in the last decade. 2022 it hit 0.42 at $15.5k. 2020 it hit 0.39 at $3.8k. now pair it with the 11th largest difficulty drop in bitcoin's entire 15-year history at -10%. hashrate down 23% from october peak means the weakest miners already flushed their BTC. 450 BTC/day in forced miner selling is ending. difficulty relief makes surviving operations profitable again immediately. five independent capitulation signals converging at once and the 7:1 short ratio is just sitting there waiting to get torched
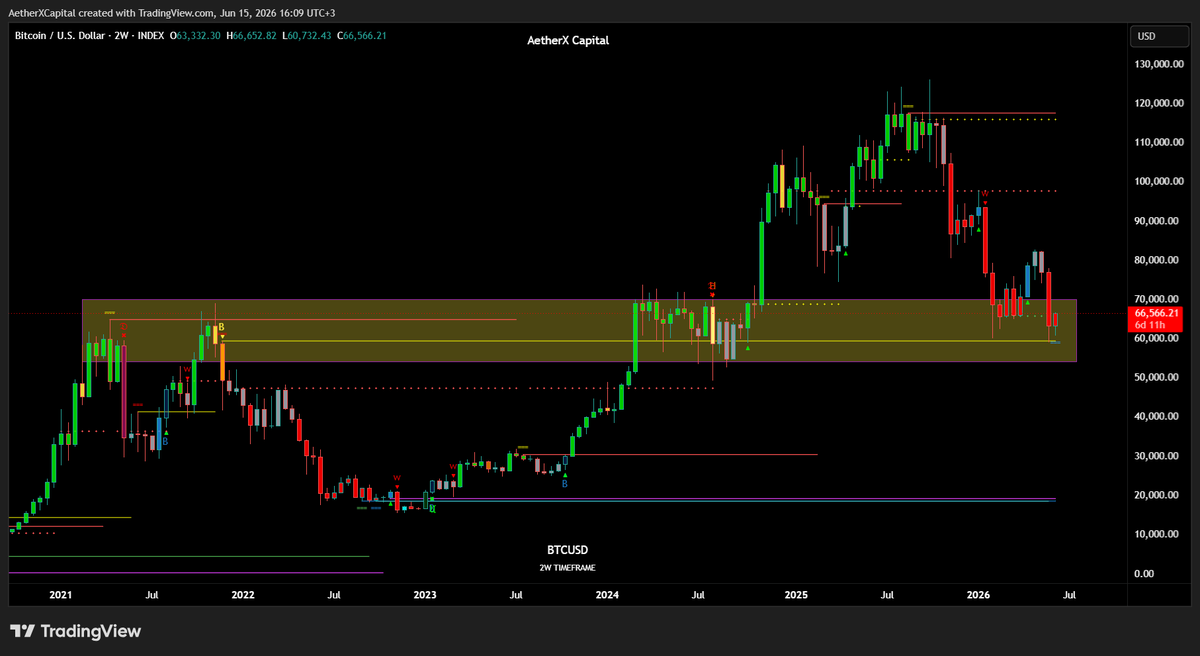
This is the 2W chart for more confluence
$BTC continues to hold above the high timeframe support at 59.4k, which has held since November 2021
Furthermore, this support lies within the area of previous all-time highs and the last consolidation that propelled Bitcoin to 126,000
Bitcoin managed to close within the previous range, which is an important development that opens the door for higher prices if the lower range holds as support
The OBV remains bearish
$BTC 1D
@RoundtableSpace The highlighted area should offer support, at least temporarily
On the other hand, the red candles indicate a likely continuation of the downward trend
$XAU 1W
@PeterLBrandt Timing usually means entry & exit; without a clear plan for when to exit (stops/targets), even perfect direction + sizing can still blow up the trade
$HYPE has just confirmed a High Exhaustion (yellow) candle on the weekly chart
Hyperliquid failed to extend higher. This signal may indicate a pause in the uptrend or the beginning of a pullback/correction
This signal is very accurate, so it shouldn't be ignored ⚠️
Indicator: Crayons gray InSilico