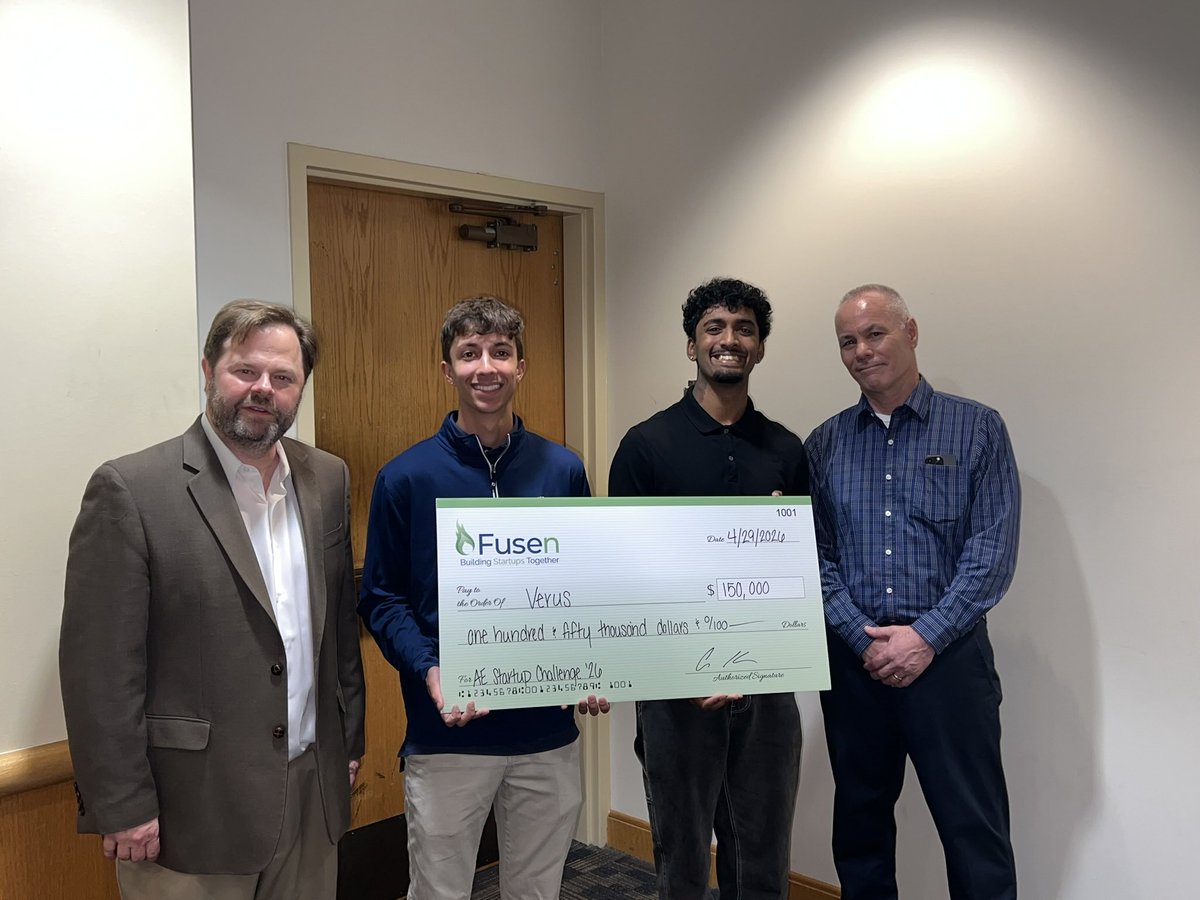
We just won $150K to fix how infrastructure inspections get analyzed.
Right now, inspecting a concrete bridge deck takes days of manual data analysis. The software either doesn't exist or is locked behind expensive hardware you have to buy first.
Verus changes that. Raw GPR data in, engineer-ready condition maps out in minutes, not weeks. Hardware agnostic. AI does the heavy lifting, engineer makes the final call.
We're incredibly excited to share that Verus won the Klaus Startup Challenge, receiving $150K from Fusen World for 10% of the company, valuing it at $1.5M.
This summer in CREATE-X, we'll be building toward our first paid pilot, getting field data into the model, and proving that our model works on real inspection data.
Goal: 90%+ accuracy on real field data by June. 3+ inspection firms on the platform by August.
We would like to extend our thanks to our mentors and judges: Jennifer Whitlow, EdD, Mitchell Walker, Joseph Oefelein, and Lydia V. Pendleton M.S., and a special thank you to Christopher Klaus believing this is a problem worth solving.
Shoutout to Taran Govindu for building this with me.
If you work in bridge inspection, NDT, or infrastructure, we'd love to connect. Stay tuned for our journey!
Join our waitlist: https://t.co/Uub8QOumMQ
We built Tempr and placed Top 2 at Georgia Tech's Hacklytics hackathon this past weekend.
Tempr is a React Native + Expo app that makes new music discovery easier by turning vibe input (text/image/context) into Spotify queues using: Supabase + Spotify OAuth, Gemini for mood inference,
and Spotify Audio Features vector matching (energy/valence/danceability/etc.)
Problem solved: better discovery, less replaying the same tracks, faster “right music for the moment.” We hope to publish to the app store soon. Below is our demo.
https://t.co/HTqy48ELbm
I’m excited to accounts that we have successfully submitted our second application to Y Combinator. After applying for the Winter ‘26 batch and making the top 10% of applications, we feel very confident and excited for what’s to come. Hoping for an interview this time around.
FluxSpace is building a safer, faster way to inspect concrete and structures using magnetic sensing and mapping, so teams can understand what’s inside without invasive testing. We’re energized by the pace and execution focus of YC, and we’re ready to keep pushing hard on this problem.
@ycombinator
I’m working on FluxSpace, a sensing and mapping project focused on making structural inspections safer, faster, and more repeatable.
Today, when there are concerns about a building’s integrity during construction or after a disaster, inspection can still be slow, manual, and sometimes dangerous. Our goal is to reduce the need for invasive testing and risky in-person checks by using magnetic sensing to detect internal features like rebar patterns, missing reinforcement, and other anomalies, then turning that data into interpretable maps.
Progress so far: I’ve built the first end-to-end data pipeline using a Raspberry Pi and a magnetometer. The workflow now supports:
- magnetic field logging with timestamps and known positions
- data validation and diagnostics that distinguish sensor glitches from potential
real data spikes
- local anomaly computation to highlight magnetic field anomalies
- 2D heatmap generation and exports for visualization and analysis
What’s next:
- controlled experiments with known metal targets to prove repeatability
- a physical concrete and rebar test to validate real-world performance
- beginning 3D mapping creation by pairing SLAM and VIO with magnetometer
readings to create a navigable 3D anomaly heatmap
Below are some images and data of what we have been able to accomplish so far. If you’re involved in drones, robotics sensing, SLAM/3D mapping, or infrastructure inspection, I’d love to connect or learn from what you’ve built.
My first hackathon at the GT Energy Hackathon is done and I built GridGuard, a load-shedding app for homes in regions where blackouts are normal.
Most smart energy tools are just dashboards with minimal data. That’s not enough when power is scarce. GridGuard helps people prepare, prioritize, and reduce non-essential loads before outages hit.
What it does:
GridGuard tracks power usage from key loads in a home and combines that with weather conditions to estimate blackout risk. It turns raw readings into simple, clear guidance and lets users reduce usage with a few button presses when the risk is rising. At a high level, we treat risk as a combination of weather stress and load stress:
How the risk score works:
It blends weather risk and load stress. Weather looks at the next hours for storms, wind gusts, heavy rain, and alerts. Load stress looks at demand versus a household budget, per-load max limits, and spike detection.
Tech stack:
We built a Next.js/React web app for the dashboard and controls, styled with Tailwind, shadcn, and Framer Motion. We used Supabase for authentication, data storage, and real-time updates, and deployed the app on Vercel. We integrated WeatherAPI to pull forecasts that help justify risk signals. For our physical proof-of-concept, we used a Raspberry Pi and Arduino setup with voltage/current sensing to produce live power data that feeds into the app.
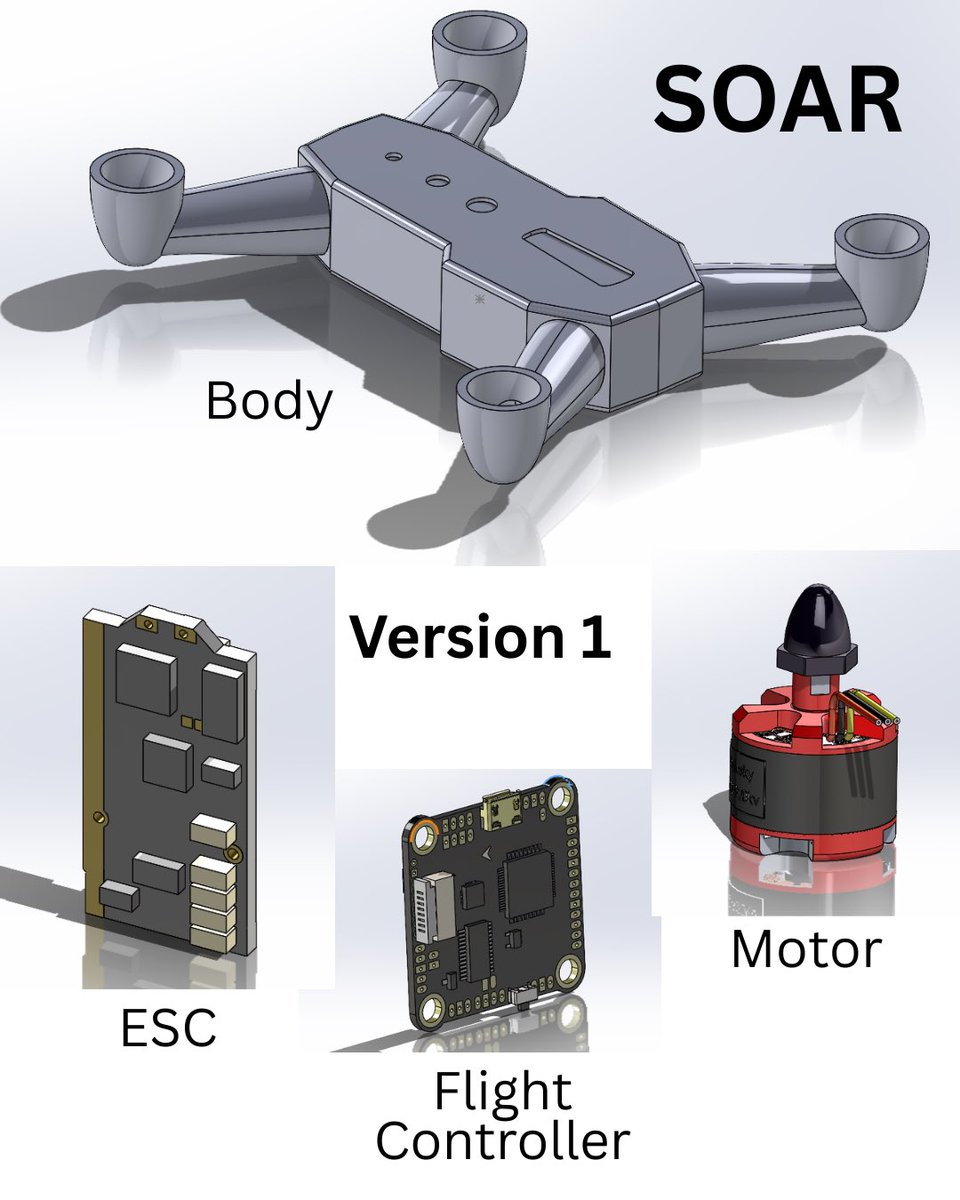
Continuing my drone project with @startupxchange. This is the first design using Solidworks. I plan to make another design or two before printing. I would love some feedback!