Todos los #mapas que he elaborado (más de 200 cartografías) se pueden descargar libremente en: https://t.co/yJpqJJpZ8D
Empecé con la divulgación allá por 2012, cuando creé https://t.co/2LW2qX4IxL, y desde siempre he creído en la difusión abierta y gratuita de contenidos 😉
Two economists just published a mathematical proof that AI will destroy the economy.
Not might. Not could. Will — if nothing changes.
The paper is called "The AI Layoff Trap." Published March 2, 2026. Wharton School, University of Pennsylvania. Boston University. Peer reviewed. Mathematically modeled.
The conclusion is one sentence.
"At the limit, firms automate their way to boundless productivity and zero demand."
An economy that produces everything. And sells it to nobody.
Here is how you get there.
A company fires 500 workers and replaces them with AI. A competitor fires 700 to keep up. Another fires 1,000. Every company is behaving rationally. Every company is following the incentives correctly. And every company is building a trap for itself.
Because the workers who were fired were also customers.
When they lose their jobs faster than the economy can absorb them, they stop spending. Consumer demand falls. Companies respond by cutting costs — which means automating more workers — which means less spending — which means more falling demand — which means more automation.
The loop has no natural exit.
The researchers tested every proposed solution. Universal basic income. Capital income taxes. Worker equity participation. Upskilling programs. Corporate coordination agreements.
Every single one failed in the model.
The only intervention that worked: a Pigouvian automation tax — a per-task levy charged every time a company replaces a human with AI, forcing them to price in the demand they are destroying before they pull the trigger.
No government has implemented this. No major economy is seriously discussing it.
Meanwhile the numbers are already tracking the curve. 100,000 tech workers laid off in 2025. 92,000 more in the first months of 2026. Jack Dorsey fired half of Block's workforce and said publicly: "Within the next year, the majority of companies will reach the same conclusion."
Nobody is doing anything wrong. Companies are following their incentives perfectly. That is exactly the problem.
Rational behavior. At scale. Simultaneously. With no mechanism to stop it.
Two economists built the math. The math leads to one place.
Source: Falk & Tsoukalas · Wharton School + Boston University ·
¡Descubre VOSviewer!
Una herramienta para visualizar redes de investigación y relaciones entre autores, documentos y más.
¡Convierte datos complejos en gráficos súper fáciles de entender!
#Ciencia#Investigación
https://t.co/gNeocGduOE
La biología en PDF acaba de morir.
Un tío hizo una app donde exploras estructuras 3D como un videojuego.
UI: GPT Images 2. Código: Gemini 3.1 Pro.
Los libros de texto ya no sirven.
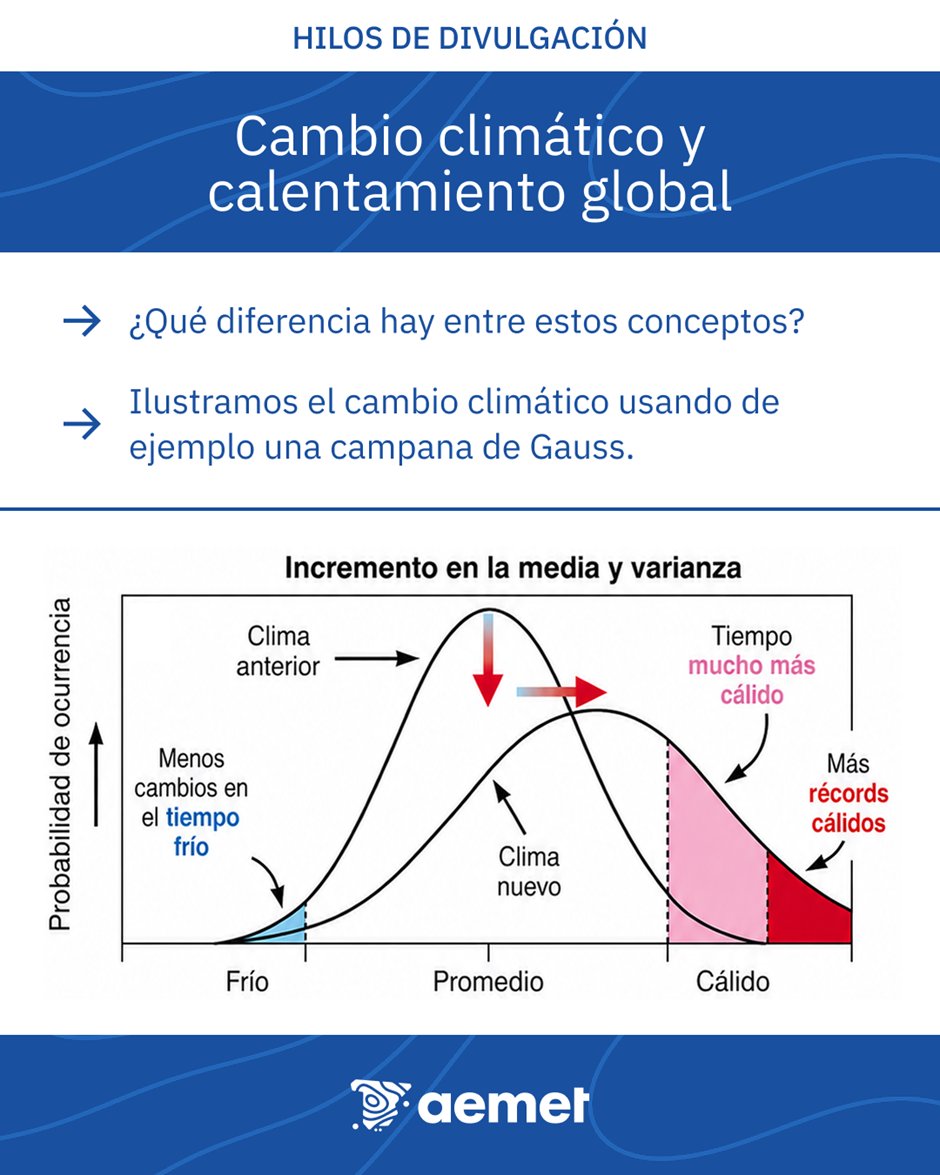
🧵🌡️Empezamos una serie de hilos en los que explicaremos las bases científicas del cambio climático. En esta primera entrega vamos a aprender a diferenciar cambio climático y calentamiento global. Os mostraremos gráficas que os ayudaran a entender los conceptos.
🌡️ Copernicus Climate Change Service reports March 2026 was the 4th-warmest globally (+1.48°C above pre-industrial).
🌍 Maps show strong contrasts: heat in the US & Arctic, colder zones in Canada & parts of Europe.
🔗 https://t.co/i5xtJ3EShu
#CopernicusEU#ImageOfTheDay
🧠 PRUEBA SOCIAL Y GUERRA COGNITIVA: INGENIERÍA DEL CONSENSO EN OPERACIONES DE INFLUENCIA DIGITAL
⚠️ No es viralidad… es manipulación: así fabrican el consenso que cambia lo que piensas
La prueba social (social proof) es un atajo cognitivo fundamental en el comportamiento humano: cuando percibimos que muchas personas aprueban una idea, producto o causa, tendemos a considerarla más creíble, segura o socialmente válida. Este mecanismo actúa especialmente en contextos de incertidumbre, donde los individuos sustituyen su propio juicio por señales externas agregadas.
En entornos digitales, esta evidencia social se manifiesta a través de métricas visibles como likes, retuits, comentarios, visualizaciones, reseñas, rankings o tendencias. Estas señales, aunque aparentemente neutras, tienen un impacto directo en la percepción de credibilidad y relevancia.
La investigación experimental demuestra que estas señales pueden inducir efectos de arrastre (herding), generando cascadas informacionales en las que los individuos imitan comportamientos previos incluso cuando su información privada sugiere lo contrario.
En el contexto de las operaciones psicológicas (psyops) y las campañas de influencia, la prueba social deja de ser un fenómeno espontáneo y pasa a ser un vector estratégico deliberadamente manipulado. Esto se logra mediante infraestructuras de amplificación que incluyen bots automatizados, trolls, cuentas humanas pagadas y redes coordinadas híbridas.
El objetivo operativo es fabricar o simular consenso, de forma que tanto los usuarios como los algoritmos interpreten señales artificiales como popularidad genuina. Este mecanismo permite influir en decisiones políticas, sociales o económicas sin necesidad de convencer directamente a cada individuo.
Este documento desarrolla un modelo completo del fenómeno, incluyendo definiciones conceptuales, tácticas operativas, casos documentados, análisis técnico de detección, implicaciones legales y estrategias de mitigación.
🧩 Marco conceptual y definiciones
La prueba social se define como un fenómeno de influencia social mediante el cual las personas infieren qué es correcto o verdadero observando el comportamiento de otros. No se trata únicamente de presión social, sino de influencia informacional: el individuo interpreta la conducta colectiva como evidencia.
En plataformas digitales, esta dinámica se traduce en señales cuantificables que actúan como heurísticas cognitivas. Estas señales no solo afectan a los usuarios, sino también a los algoritmos de recomendación, que amplifican contenido en función de su interacción percibida.
Este fenómeno está estrechamente vinculado a conceptos como:
▪️ Principios de persuasión (Cialdini)•
▪️Cascadas informacionales.
▪️ Sesgos de validación social.
Por otro lado, las psyops (operaciones psicológicas), en su definición doctrinal, consisten en acciones planificadas destinadas a influir en emociones, razonamiento y comportamiento de audiencias específicas mediante comunicación estratégica.
En este análisis se adopta una
visión amplia del término, incluyendo tanto campañas militares como operaciones de influencia en entornos digitales.
La desinformación se define como contenido falso o engañoso difundido con intención de manipular o causar daño, diferenciándose de la misinformación por la existencia de intencionalidad.
Un elemento clave es el comportamiento coordinado inauténtico (CIB), que no se centra únicamente en el contenido, sino en la forma en que se organiza y ejecuta la actividad. La manipulación se produce mediante coordinación, ocultación de identidad y amplificación artificial.
Finalmente, la manipulación moderna combina tres elementos:
▪️Automatización (bots)
▪️Intervención humana (trolls y operadores)
▪️Externalización (empresas privadas o agencias)
Continúa en el post siguiente
Starting a PhD soon? Download this easy to use thesis planner (free). You can map out the major phases of your #PhD. Then bring it along to a meeting with your supervisor and discuss if realistic. https://t.co/qiM3X2bwCs #PhDchat#ECRchat#postdoc#research
Google acaba de dar a estudiantes universitarios acceso GRATIS a Gemini 3.1 Pro durante 1 año.
Normalmente cuesta 240€/año.
Tienes hasta el 30 de abril para reclamarlo.
Cómo hacerlo en 3 pasos 👇
Are AI Tools Replacing Scientific Writing?
Here's what some leading scientists have to say ⤵
Repost & Save (with 𝘤𝘭𝘪𝘱𝘱𝘦.𝘮𝘦)
— Tools like ChatGPT are good helpers
(but poor creators)
— AI can speed up writing
(but it's not ready to take over scientific thinking).
— The real question isn't if we should use AI...
... but how to use it wisely!
𝐊𝐞𝐲 𝐁𝐞𝐧𝐞𝐟𝐢𝐭𝐬 𝐨𝐟 𝐀𝐈 𝐢𝐧 𝐒𝐜𝐢𝐞𝐧𝐭𝐢𝐟𝐢𝐜 𝐖𝐫𝐢𝐭𝐢𝐧𝐠 ⤵
𝗪𝗿𝗶𝘁𝗶𝗻𝗴 𝗔𝘀𝘀𝗶𝘀𝘁𝗮𝗻𝗰𝗲
— Helps break through writer's block
— Makes helpful suggestions for titles & abstracts
— Supports non-native English speakers with clear writing
𝗦𝘁𝗿𝘂𝗰𝘁𝘂𝗿𝗲 & 𝗥𝗲𝗳𝗲𝗿𝗲𝗻𝗰𝗲𝘀
— Breaks complex topics into manageable pieces
— Spots relevant papers you might have missed
— Helps organize thoughts & arguments
𝐌𝐚𝐣𝐨𝐫 𝐂𝐨𝐧𝐜𝐞𝐫𝐧𝐬
— AI can't do deep analysis or generate true insights
— Risk of shallow, cookie-cutter science writing
— Tools might generate false references or incorrect info
— Over-reliance could hurt students' learning
Page 1/3
🚨 BREAKING: Someone built an AI that replaces 6 months of literature review with a single workspace.
It's called Moara.
You dump your research papers in. The AI organizes, analyzes, and synthesizes everything across hundreds of millions of academic sources.
You come back and there's a structured literature review waiting. Not a chatbot answer. Not a vague summary. The actual research synthesis.
A full research workspace that thinks like a scientist.
Works for medicine, engineering, social sciences, law, business, humanities — every discipline.
Here's what it does on its own:
→ Searches hundreds of millions of papers across PubMed, arXiv, Google Scholar, Semantic Scholar, ClinicalTrials .gov, Cochrane, and more in one shot
→ Screens and tags results automatically, pulling out methodologies, findings, and contributions from every paper
→ Lets you chat with your entire library at once, find themes, spot gaps, and compare findings across dozens of papers simultaneously
→ Integrates with Zotero, LibKey, RIS, and BibTeX so your existing research workflow doesn't break
→ Traces every AI insight back to its original source so nothing is hallucinated and everything is verifiable
→ Supports full team collaboration so entire research groups can screen and synthesize together
Try it here:
https://t.co/3n1sqOFU0x
Notición!
A la práctica significa que cualquier grupo de investigación afiliado a una institución española podrá enviar sus artículos a #ORE para que sean publicados allí, sin coste, si pasan la revisión por pares abierta.
Esto será operativo a partir de este otoño🚀
Cartografía en el aula: Herramientas digitales para clases de Geografía e Historia (II)
Recursos digitales gratuitos 🗺️📍
Dos nuevos recursos: GeoCron y Running Reality para trabajar con atlas históricos digitales e interactivos
📲 https://t.co/YjhUIUXr6U
🌍📊 ¿Sabías que la FAO te da acceso GRATIS a +20 bases de datos sobre agricultura, comercio, precios, pesca, bosques y más?
Datos abiertos que impulsan decisiones globales.
Explóralos hoy 👉 https://t.co/uUWVqi7PES
#FAOData#OpenAccess
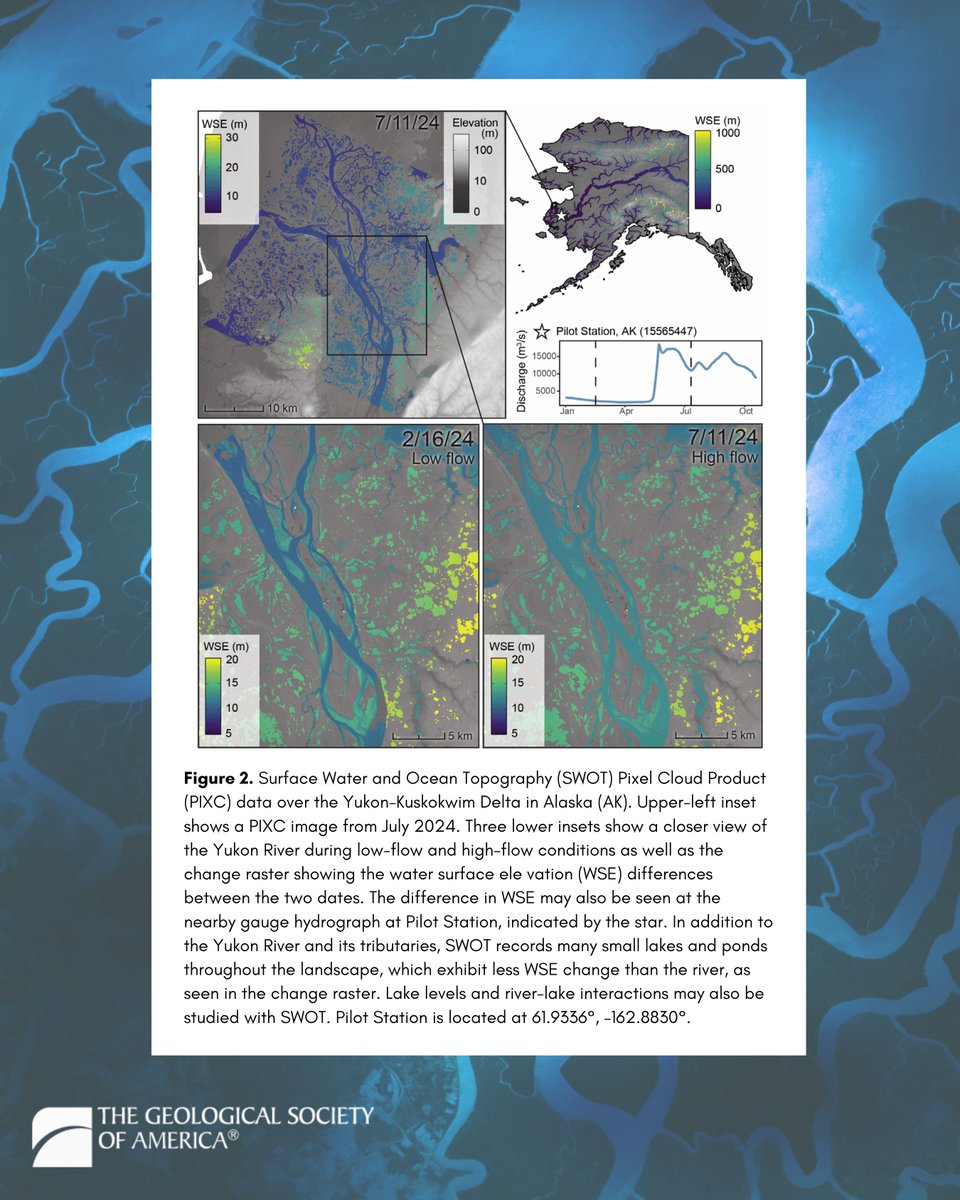
How do rivers actually shape our planet—at a global scale?
A new study published in GSA Today is changing the way scientists answer that question—using data from NASA’s SWOT satellite to track how rivers erode, transport sediment, and reshape landscapes across Earth.
Traditionally, studying rivers meant detailed (but localized) fieldwork. Now, this research shows how we can monitor river dynamics worldwide—from shifting channels and sediment transport to knickpoints, floods, and even dam failures—all in near real time.
In this new era of fluvial geomorphology where we can connect local river processes to global patterns, we can also better understand risks to infrastructure, ecosystems, and communities.
This work is already gaining broader attention and has been featured in MSN and Yahoo News—but the full story and the science behind it starts with the original paper: https://t.co/Bt5sAMbuR3
#NASA #RemoteSensing #Geomorphology
[PAQUETE 📦] - 🧩 [RTIP] - bbplot: Hacé gráficos con el estilo profesional de la BBC News
¿Tus gráficos en ggplot2 se ven amateuristas? bbplot es el paquete que usá la BBC News para crear visualizaciones con un estilo profesional, limpio y consistente. Con pocas líneas de código, podés transformar tus gráficos en productos de calidad editorial.
✔️ bbc_style() aplicá automáticamente la paleta de colores, tipografía y formato que usa la BBC News en todos sus reportes.
✔️ finalise_plot() exportá tus gráficos con las dimensiones y resolución correctas para publicación web y print.
✔️ Estilo consistente sin configurar manualmente fuentes, ejes ni márgenes — ahorrá tiempo y garantizá coherencia visual.
💡 Tip
Instalá bbplot desde GitHub con `devtools::install_github('bbc/bbplot')` y combinalo con tu flujo de ggplot2 habitual. Aplicá `bbc_style()` al final de tu código antes de exportar. Perfecto si trabajás con reportes, dashboards o publicaciones que necesiten verse profesionales.
🔗 https://t.co/aJUJkZcgC5
✍️ BBC News data team
#RStats #RStatsES #Rtips #DataScience


![estacion_erre's tweet photo. [PAQUETE 📦] - 🧩 [RTIP] - bbplot: Hacé gráficos con el estilo profesional de la BBC News
¿Tus gráficos en ggplot2 se ven amateuristas? bbplot es el paquete que usá la BBC News para crear visualizaciones con un estilo profesional, limpio y consistente. Con pocas líneas de código, podés transformar tus gráficos en productos de calidad editorial.
✔️ bbc_style() aplicá automáticamente la paleta de colores, tipografía y formato que usa la BBC News en todos sus reportes.
✔️ finalise_plot() exportá tus gráficos con las dimensiones y resolución correctas para publicación web y print.
✔️ Estilo consistente sin configurar manualmente fuentes, ejes ni márgenes — ahorrá tiempo y garantizá coherencia visual.
💡 Tip
Instalá bbplot desde GitHub con `devtools::install_github('bbc/bbplot')` y combinalo con tu flujo de ggplot2 habitual. Aplicá `bbc_style()` al final de tu código antes de exportar. Perfecto si trabajás con reportes, dashboards o publicaciones que necesiten verse profesionales.
🔗 https://t.co/aJUJkZcgC5
✍️ BBC News data team
#RStats #RStatsES #Rtips #DataScience](https://pbs.twimg.com/media/HE_rXcyWMAArZuM.jpg)


