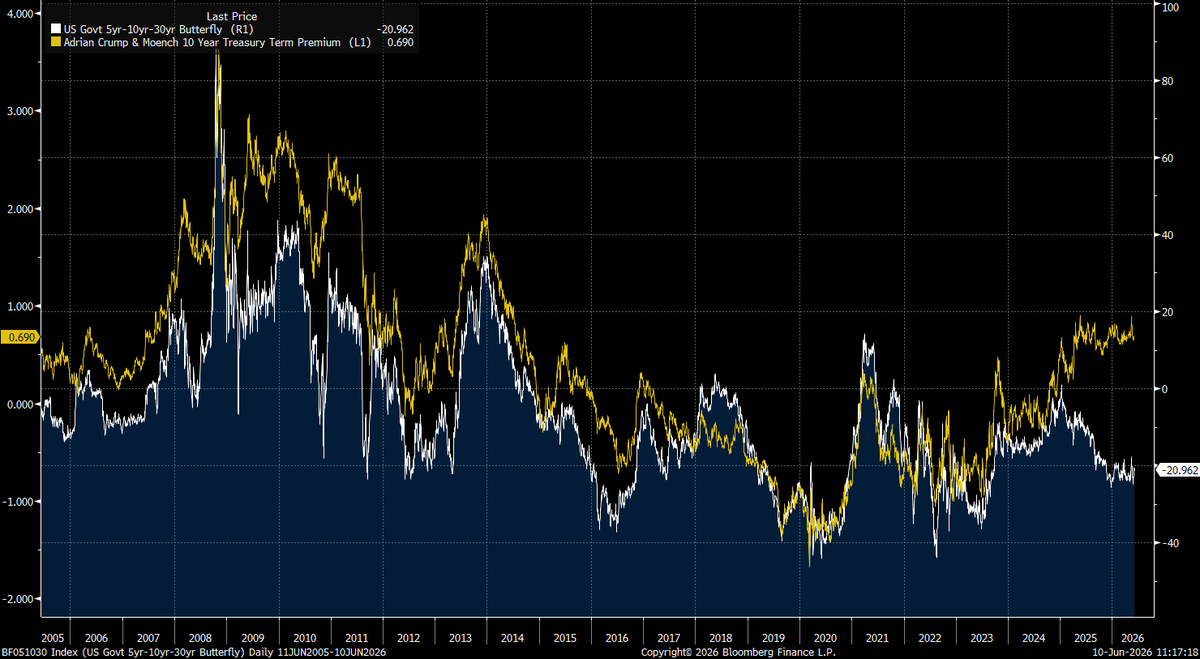
With a UST 10y auction on deck, timely to look at 10s on the curve. The 5s10s30s 'fly which generally tracks the term premium has diverged recently with 10s richening up. Not a fan of the belly generally but this just adds to my disdain
On a YTD, nonseasonally adjusted basis, the core CPI is running a little higher than in 2025 but below 2024 (a year in which the shelter disinflation really kicked in as the year went on).
Core CPI came in line, but note that the Clev Fed's median CPI will very likely be 0.30% (3.66% SAAR) and its 16% trimmed mean will be 0.275% (3.35% SAAR). Supercore was also 0.27% (YoY up from 3.2% to 3.5%). Rent/OER firmer vs my 0.27% SA estimate. So, firmer under the hood.
The jobs report was a barnburner. Nonfarm payrolls increased by 172,000 versus expectations for 88,000, while prior months were revised higher by 93,000. Wage growth came in at roughly 0.3%. Yet the market sold off. In our view, the market is misreading the signal. It is assuming that stronger than expected employment and growth will cause a an acceleration in inflation. History would suggest otherwise. Productivity growth is running near 3%, while unit labor costs are hovering around 0.5%. Those are not the hallmarks of an inflationary boom. They are the hallmarks of healthy, productivity-driven growth that will lower inflation. Meanwhile, the yield curve continues to flatten despite a roughly 55% increase in oil prices year-over-year based on a three month moving average. In past cycles, an energy shock of this magnitude steepened the yield curve when the Federal Reserve was accommodating it. Instead, the bond market appears to be discounting something much more powerful: the deflationary impact of technological innovation, particularly artificial intelligence, which is beginning to increase productivity across broad swaths of the economy. If tensions with Iran ease and oil prices retreat, we believe inflation could move into negative territory before year-end. In our view, the Fed made a historic policy error when it raised rates aggressively into what was largely a supply-driven inflation shock in 2022. We do not believe the next generation of monetary policymakers will be eager to repeat that mistake. Notably, gold peaked on the day Kevin Warsh was appointed. The inflation trade may already be behind us. If our research is correct, the next phase of this cycle could be characterized by accelerating growth, declining inflation, falling interest rates, and a strengthening U.S. dollar. That combination would create a remarkably supportive backdrop for innovation-led equities and the technologies driving the next productivity boom. I discuss this framework in greater detail in this month’s episode of In The Know.
The Iranian navy, which has been destroyed eight times, has apparently closed the Strait of Hormuz again, because the United States, for the seventh time, won the war that wasn’t a war, so now the United States has to open the Strait of Hormuz that was already open before the not-war began.
The not-war began because Iran had uranium that was totally, completely, beautifully obliterated, so they can’t build the nuclear bomb they weren’t building, which is why the United States had to start the not-war it definitely didn’t start.
Now the United States, which has nuclear weapons, is threatening to use nuclear weapons to stop Iran from getting nuclear weapons, because nuclear weapons are far too dangerous for countries with nuclear weapons to allow other countries to have.
If the United States saw the United States doing what the United States does in other countries, the United States would invade the United States to liberate the United States from the tyranny of the United States.
The driver was jobs print surprised to upside. UST yields rose in response, in particular the 2yr as more jobs translates to a U.S. economy that’s growing. UST yields up with breakevens down says market sees a good portion of this growth as non-CPI inflationary. Financials outperforming says market believes the U.S. economy has the room and resources to accommodate the balance sheet expansion this growth requires.
This comes riding on a bigger tailwind of excess money outside of U.S. flowing into the U.S. financial system that’s arising from rest of world’s lower growth and lack of demand for money/borrowing in response to the commodity market and crypto disruption from Epic & Economic Fury. So $DXY continued to get bid today.
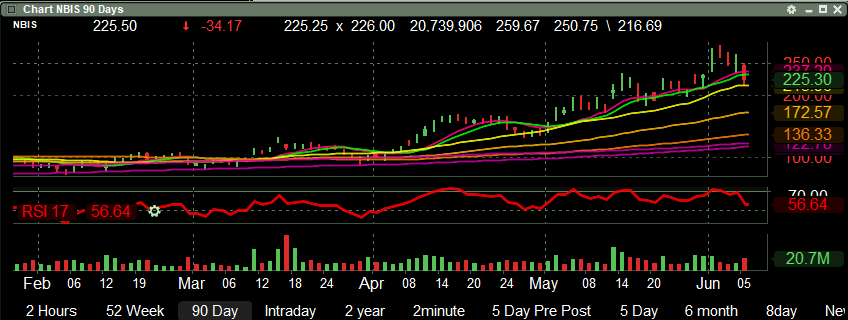
On the equities selloff, my hunch is the 10 bps rise in front end rates forced some deleveraging in the AI buildout names on accounts that got ahead of their skis. Caught the momentum chasers who rode the rip too hard / too long. If the jobs print is right, would suggest this is a pullback for risk but the primary trend is intact. Bitcoin continues to get sold and the higher rates did no favors for the perpetuals and other frontier/cuspy credits that were already struggling.
ECB is the real loser today IMO. They are a lock to hike next Thursday into their own growth weakness. They need EUR to fetch a bid and today does nothing to help their cause. We’ll get to see the rest of the world’s response when markets open Sunday evening.
Getting To The Truth In The May 2026 Employment Situation
The Headline Looked Solid
The May jobs report gave markets a clean surface narrative. Nonfarm payrolls rose 172,000, unemployment held at 4.3%, wages rose 0.3%, and March and April were revised higher by a combined 93,000 jobs. That bought the soft landing story more time.
But the problem is what carried the number. The gains were not broad based private sector strength. They were concentrated in leisure and hospitality, local government, and health care, while financial activities lost 22,000 jobs and transportation and warehousing remains down 92,000 from its prior peak.
The Biggest Contradiction
The most worrisome data point is the split between payroll jobs and actual people employed. Over the last year, the establishment survey shows payroll jobs up roughly 503,000, while the household survey shows employment down roughly 473,000.
That undermines the bullish narrative more than anything else in the report. Payrolls count jobs. The household survey counts people. So the headline says employers are still adding jobs, but the people based survey says fewer people are employed than a year ago. That is a warning that the headline is being supported by job count mechanics, multiple job dynamics, sector mix, and statistical treatment rather than broad real world employment growth.
The Unemployment Rate Is Being Flattered
The 4.3% unemployment rate also looks better because labor force participation is weak. Participation is only 61.8%, down from 62.4% a year ago. The civilian population grew, but the labor force shrank. That keeps the unemployment rate lower than it would be if missing workers were still counted.
There are also 6.2 million people outside the labor force who say they want a job, but they are not counted as unemployed because they are not actively looking or are unavailable. That is the fine print behind the calm headline.
Job Quality Is Deteriorating
The deeper weakness is quality, not just quantity.
• Full time employment fell by 79,000 in May
• Part time employment rose by 266,000
• U-6 is 8.1%, almost double the official rate
• Long term unemployment is up 524,000 over the year
• 27.5% of unemployed workers have been jobless for 27 weeks or longer
This is what a late cycle labor market often looks like before the headline finally breaks.
The Sector Mix Is Not Healthy
Leisure and hospitality added 70,000 jobs, with food services and drinking places adding 48,000. Local government added 55,000. Health care added 35,000. Those three areas explain most of the headline gain.
Meanwhile, the higher signal parts of the economy are not confirming the story. Financial activities declined. Retail was flat. Professional and business services barely grew. Information declined. Transportation remains pressured. A healthy expansion is usually led by broad private sector hiring. This report was held together by lower wage services, government, and defensive health care.
The Revision Risk Matters
The short term revisions were positive, but the bigger revision history is the warning. The March 2025 benchmark revision erased 898,000 jobs and cut full year 2025 payroll growth from 584,000 to only 181,000. That means the labor market looked much stronger in real time than it looked after tax record reality caught up.
Bottom Line
This was a real payroll beat, but it was a low quality beat. The cleanest contradiction is that payroll jobs are up over the last year while actual household employment is down. Add weak participation, hidden workers outside the labor force, part time substitution, narrow hiring concentration, and prior benchmark revisions, and the picture changes fast. The labor market is not completely falling apart yet, but it is much weaker than the 4.3% unemployment rate makes it look.
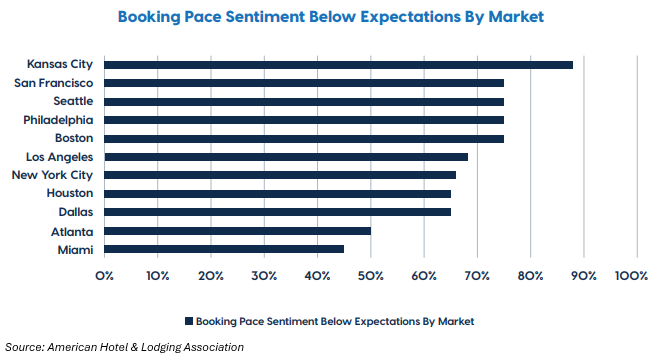
World Cup hiring narrative seems overblow, esp in L&H. NSA% rise at restaurants & hotels was 2.04%, below 2.10% last May and same as avg from 2022-2025. 4wk seasonal helped a lot here. Also, barely any mention in Beige Book of WC. AHLA report pointed to weakness at hotels.
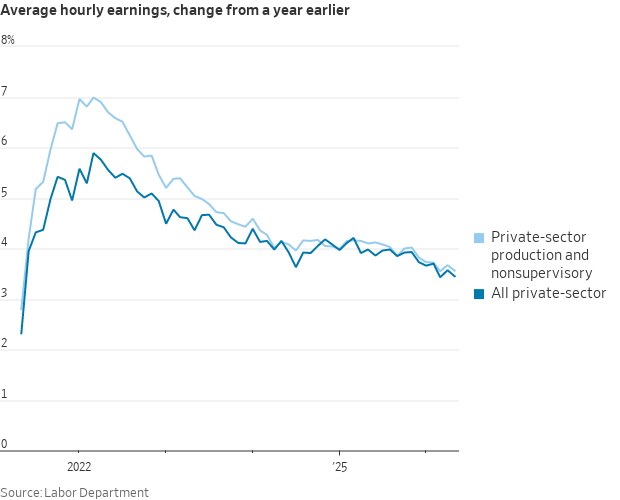
Wage growth over the 12 months ending in May was close to its lowest level in the post-pandemic period.
The index of aggregate weekly payrolls for private-sector workers (which combines hiring, wages, and hours) was +4.3% for the year—near the pre-pandemic level.
US petroleum stockpiles are draining at a rapid pace:
Total US crude and petroleum product inventories fell -10.6 million barrels last week, to 1.57 billion barrels, the lowest since 2004, according to the EIA.
This was driven by commercial and government crude stocks, which fell -15.9 million barrels, the 2nd-largest weekly drop on record.
The drawdown comes as exports to Asia and Europe are surging, with global markets scrambling to replace lost Middle Eastern supplies.
Before the Iran War, US crude and petroleum product exports were ~3.0 million barrels per day. They are now up to 13.6 million barrels per day, the 2nd-highest reading on record.
Meanwhile, the Strategic Petroleum Reserve fell another -7.9 million barrels last week, now down -58 million barrels since the start of the war, to 357 million barrels, the lowest since January 2024.
The US is acting as the lender of last resort for global oil markets.
The solid rise in private payrolls in May was well flagged by NFIB survey’s hiring intentions index a few months ago, which has since turned south. Labor market not out of the woods yet.
BREAKING: Assets in US money market funds surged +$66 billion in the week ending May 28th, to a record $8.28 trillion.
+$41 billion of that came in a single day as investors rebalanced their portfolios ahead of month-end.
Year-to-date, money market funds have attracted +$172 billion in total inflows.
Since the 2020 pandemic, total assets have soared +112%, or +$4.4 trillion.
This comes as the market is pricing in a ~60% probability of a Fed rate hike this year, supporting demand for short-term cash-like assets.
Meanwhile, the 7-day average yield for US money market funds stood at 3.34% as of May 28th.
Investors are anticipating the Fed's next move.
BREAKING: Iran’s Foreign Minister Araghchi releases a statement after Iranian strikes on Kuwait.
“Our Armed Forces are conducting self-defense strikes on sites the U.S. is permitted to use to attack civilian shipping and violate the ceasefire.
Any hostile act will be met with an immediate, decisive response. What sanctions and war failed to achieve won't be won with more war,” he says.