🤖 AI hallucinates. But is the bigger hallucination now in the market?
AI is brilliant. The technology is real. The potential is enormous.
But when trillions chase a technology that still needs time to mature, the danger may lie less in the machine — and more in the expectations surrounding it.
My take on AI, hallucinations, vibe coding, human oversight, and the bubble building around the story. 👇
#AI #ArtificialIntelligence #AIHallucinations #AIBubble #GenerativeAI #IndiaAI #SovereignAI #AIHype #ResponsibleAI #LLM
#BRICS #BRICSSummit #BRICS2026 #BharatMandapam #Putin #XiJinping #AnantAmbani #NewDelhi
🤖 AI hallucinates. But what if the bigger hallucination is the AI bubble itself? Brilliant technology, wild valuations, rushed adoption — and trillions betting that maturity can be bought overnight. My take 👇 #AI#AIBubble https://t.co/u2Zh3gKfDe
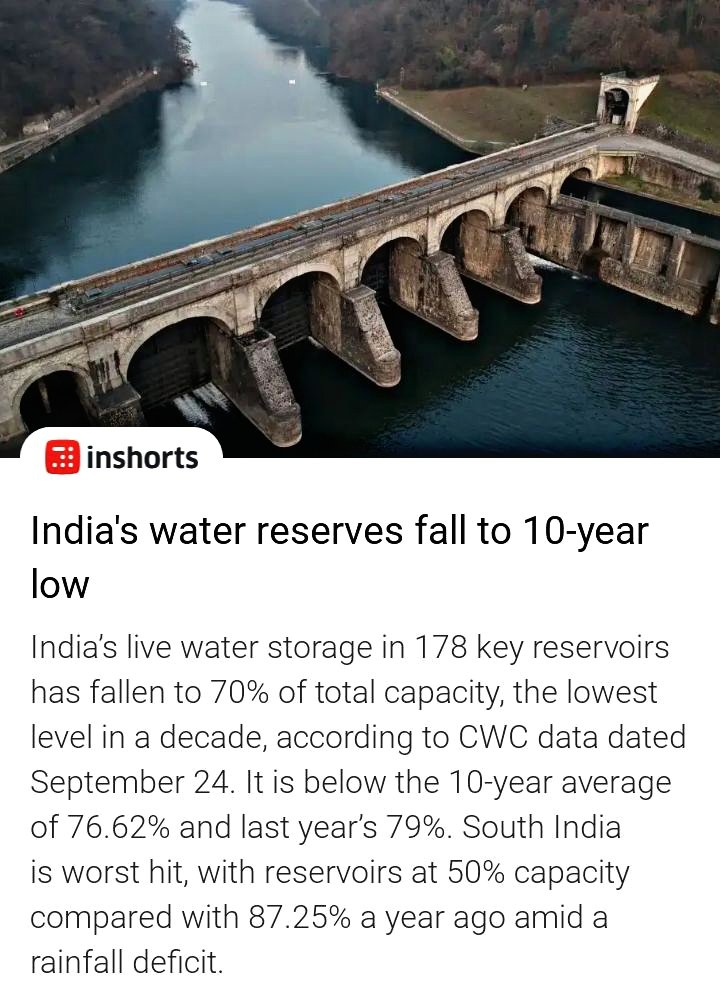
The real water reserve is beneath our feet. Soil has the capacity to hold 800% more water than all the rivers put together. But that potential can be realized only when the land has substantial native vegetation in the form of trees, bushes, summer crops, or ground cover that enriches the soil organic content. It is not just about building more dams to store more water. The biggest dam on the planet is the Soil. –Sg #SaveSoil
🚨🔥 GLOBAL MARKETS: THE BOND MARKET IS NOW THE MAIN EVENT
The centre of gravity has shifted.
This week is no longer just about oil, Gold or the Fed.
It is about one uncomfortable signal from the US bond market:
📉 US data is weakening…
BUT
📈 LONG-TERM YIELDS KEEP RISING.
That is unusual.
🇺🇸 JOLTS: 7.08m vs 7.23m expected
🇺🇸 Consumer Confidence: 81.9 — lowest since 2014
🏦 October Fed hike odds: down to ~50% from 70%+
Yet:
📉 US 2Y: 4.89%
📈 US 10Y: 5.26% — highest since 2007
📈 US 30Y: 5.59% — highest since 2002
🔥 THIS IS THE REAL STORY.
Inflation expectations are barely moving.
But real yields are exploding.
🇺🇸 10Y real yield: ~2.90%
🇺🇸 5Y real yield: ~2.73%
Both around the highest since 2008.
So the market is not simply pricing “more inflation”.
It is demanding a much higher REAL return to hold long-dated US debt.
That means:
💳 Higher term premium
🏦 Higher cost of capital
📉 Greater pressure on risk assets
🌍 Tighter global financial conditions
And this is no longer just an American story.
🇯🇵 Japan 10Y: ~3.09% — near 30-year highs
🇪🇸 Spain inflation: 5.0% — energy shock feeding back into prices
━━━━━━━━━━━━━━
🛢️ CRUDE: MORE BARRELS ARE FINALLY SHOWING UP
Brent November settled near $102.59.
WTI near $89.38.
West Asian export flows have recovered sharply:
📉 March low: ~6–7 mbpd
📈 Latest 7-day pace: low-20s mbpd
Why?
🇸🇦 East–West pipeline partially restored
⚓ Yanbu loadings restarted
🚢 Hormuz flows improved
🇺🇸 US offering up to 40m barrels from SPR
So oil is being supplied from TWO directions:
PHYSICAL FLOWS ↑
+
EMERGENCY BARRELS ↑
That is why the risk premium is deflating so quickly.
But be careful.
⚠️ Iranian exports remain largely absent
⚠️ Latest flow spike is provisional
⚠️ Product tightness remains severe
⚠️ November contract expiry creates a mechanical price reset
December Brent near $96.50 is NOT a fresh collapse.
It is backwardation being realised.
🎯 December Brent:
🟢 Support: $90–92
🔴 Resistance: $101–102
Above $90–92, the broader structure remains constructive.
━━━━━━━━━━━━━━
⛽ THE BIGGER PROBLEM IS STILL DIESEL
Crude tightness is easing.
PRODUCT tightness is not.
US distillate stocks remain roughly 12% below the 5-year average.
Bypass pipelines can move crude.
They cannot manufacture diesel.
That is why crude traders should now watch FOUR things:
1️⃣ Gulf export flows
2️⃣ Diesel inventories
3️⃣ Iranian barrels
4️⃣ Actual SPR take-up
If Gulf flows hold through October:
📉 Crude shortage effectively neutralised
If flows fall back into the teens:
🔥 Risk premium returns very quickly
━━━━━━━━━━━━━━
🥇 GOLD: $4,100 DID ITS JOB
Gold defended the key $4,100 zone and bounced towards $4,180.
🟢 Support: $4,100
🔴 Resistance: $4,250
But real yields near 3% remain the big cap.
Tonight’s PCE data becomes crucial.
Softer inflation = breathing room for Gold.
Hotter inflation = real yields stay dominant.
━━━━━━━━━━━━━━
🥈 SILVER: $60 REMAINS THE FLOOR
Silver held the major $60 support and recovered towards $61.
🟢 Support: $60
🔴 Resistance: $62–62.50
Still choppy.
Still highly sensitive to real yields and base metals.
━━━━━━━━━━━━━━
💵 DOLLAR + 🇮🇳 USDINR
DXY is approaching an important resistance zone:
🚧 101.6–102
USDINR remains below the key 96.30–96.50 zone.
🟢 Support: 95.50
🔴 Resistance: 96.30–96.50
RBI remains active.
But:
📈 High US yields
📉 Portfolio outflows
🛢️ Oil sensitivity
continue to keep pressure on the Rupee.
━━━━━━━━━━━━━━
🔥 THE MARKET MAP
Tonight:
📊 US PCE
📈 Final Q2 GDP
🛢️ US inventories
Friday:
👷 Payrolls
Sunday:
🛢️ OPEC+
7 October:
🇮🇳 RBI
But the ONE variable connecting everything remains:
⚓ CAN THE RECOVERY IN GULF EXPORT FLOWS HOLD?
If YES:
🛢️ Oil ↓
📉 Inflation pressure ↓
🏦 Fed pressure ↓
🥇 Metals breathe
🇮🇳 INR stabilises
If NO:
🔥 Energy risk premium rebuilds very fast.
And above all:
📈 Weak data + rising long-term yields is the signal everyone should be watching.
That is where the real macro stress is hiding.
#US10Y #US30Y #TreasuryYields #BondMarket #RealYields #FederalReserve #Fed #FOMC #PCE #Payrolls #Inflation #Gold #GoldPrice #XAUUSD #Silver #SilverPrice #PreciousMetals #Bullion #CrudeOil #Brent #WTI #OilPrices #EnergyMarkets #Diesel #Refining #Hormuz #StraitOfHormuz #SaudiArabia #Iran #SPR #OPEC #OPECPlus #USDINR #Rupee #DXY #Dollar #RBI #InterestRates #GlobalMacro #Macro #Commodities #CommodityTrading #FinancialMarkets #GlobalMarkets #Trading #Investing #MarketOutlook
🚨🔥 GLOBAL MARKETS: THE BOND MARKET IS NOW THE MAIN EVENT
The centre of gravity has shifted.
This week is no longer just about oil, Gold or the Fed.
It is about one uncomfortable signal from the US bond market:
📉 US data is weakening…
BUT
📈 LONG-TERM YIELDS KEEP RISING.
That is unusual.
🇺🇸 JOLTS: 7.08m vs 7.23m expected
🇺🇸 Consumer Confidence: 81.9 — lowest since 2014
🏦 October Fed hike odds: down to ~50% from 70%+
Yet:
📉 US 2Y: 4.89%
📈 US 10Y: 5.26% — highest since 2007
📈 US 30Y: 5.59% — highest since 2002
🔥 THIS IS THE REAL STORY.
Inflation expectations are barely moving.
But real yields are exploding.
🇺🇸 10Y real yield: ~2.90%
🇺🇸 5Y real yield: ~2.73%
Both around the highest since 2008.
So the market is not simply pricing “more inflation”.
It is demanding a much higher REAL return to hold long-dated US debt.
That means:
💳 Higher term premium
🏦 Higher cost of capital
📉 Greater pressure on risk assets
🌍 Tighter global financial conditions
And this is no longer just an American story.
🇯🇵 Japan 10Y: ~3.09% — near 30-year highs
🇪🇸 Spain inflation: 5.0% — energy shock feeding back into prices
━━━━━━━━━━━━━━
🛢️ CRUDE: MORE BARRELS ARE FINALLY SHOWING UP
Brent November settled near $102.59.
WTI near $89.38.
West Asian export flows have recovered sharply:
📉 March low: ~6–7 mbpd
📈 Latest 7-day pace: low-20s mbpd
Why?
🇸🇦 East–West pipeline partially restored
⚓ Yanbu loadings restarted
🚢 Hormuz flows improved
🇺🇸 US offering up to 40m barrels from SPR
So oil is being supplied from TWO directions:
PHYSICAL FLOWS ↑
+
EMERGENCY BARRELS ↑
That is why the risk premium is deflating so quickly.
But be careful.
⚠️ Iranian exports remain largely absent
⚠️ Latest flow spike is provisional
⚠️ Product tightness remains severe
⚠️ November contract expiry creates a mechanical price reset
December Brent near $96.50 is NOT a fresh collapse.
It is backwardation being realised.
🎯 December Brent:
🟢 Support: $90–92
🔴 Resistance: $101–102
Above $90–92, the broader structure remains constructive.
━━━━━━━━━━━━━━
⛽ THE BIGGER PROBLEM IS STILL DIESEL
Crude tightness is easing.
PRODUCT tightness is not.
US distillate stocks remain roughly 12% below the 5-year average.
Bypass pipelines can move crude.
They cannot manufacture diesel.
That is why crude traders should now watch FOUR things:
1️⃣ Gulf export flows
2️⃣ Diesel inventories
3️⃣ Iranian barrels
4️⃣ Actual SPR take-up
If Gulf flows hold through October:
📉 Crude shortage effectively neutralised
If flows fall back into the teens:
🔥 Risk premium returns very quickly
━━━━━━━━━━━━━━
🥇 GOLD: $4,100 DID ITS JOB
Gold defended the key $4,100 zone and bounced towards $4,180.
🟢 Support: $4,100
🔴 Resistance: $4,250
But real yields near 3% remain the big cap.
Tonight’s PCE data becomes crucial.
Softer inflation = breathing room for Gold.
Hotter inflation = real yields stay dominant.
━━━━━━━━━━━━━━
🥈 SILVER: $60 REMAINS THE FLOOR
Silver held the major $60 support and recovered towards $61.
🟢 Support: $60
🔴 Resistance: $62–62.50
Still choppy.
Still highly sensitive to real yields and base metals.
━━━━━━━━━━━━━━
💵 DOLLAR + 🇮🇳 USDINR
DXY is approaching an important resistance zone:
🚧 101.6–102
USDINR remains below the key 96.30–96.50 zone.
🟢 Support: 95.50
🔴 Resistance: 96.30–96.50
RBI remains active.
But:
📈 High US yields
📉 Portfolio outflows
🛢️ Oil sensitivity
continue to keep pressure on the Rupee.
━━━━━━━━━━━━━━
🔥 THE MARKET MAP
Tonight:
📊 US PCE
📈 Final Q2 GDP
🛢️ US inventories
Friday:
👷 Payrolls
Sunday:
🛢️ OPEC+
7 October:
🇮🇳 RBI
But the ONE variable connecting everything remains:
⚓ CAN THE RECOVERY IN GULF EXPORT FLOWS HOLD?
If YES:
🛢️ Oil ↓
📉 Inflation pressure ↓
🏦 Fed pressure ↓
🥇 Metals breathe
🇮🇳 INR stabilises
If NO:
🔥 Energy risk premium rebuilds very fast.
And above all:
📈 Weak data + rising long-term yields is the signal everyone should be watching.
That is where the real macro stress is hiding.
#US10Y #US30Y #TreasuryYields #BondMarket #RealYields #FederalReserve #Fed #FOMC #PCE #Payrolls #Inflation #Gold #GoldPrice #XAUUSD #Silver #SilverPrice #PreciousMetals #Bullion #CrudeOil #Brent #WTI #OilPrices #EnergyMarkets #Diesel #Refining #Hormuz #StraitOfHormuz #SaudiArabia #Iran #SPR #OPEC #OPECPlus #USDINR #Rupee #DXY #Dollar #RBI #InterestRates #GlobalMacro #Macro #Commodities #CommodityTrading #FinancialMarkets #GlobalMarkets #Trading #Investing #MarketOutlook
🚨🛢️ OIL SELLOFF: THE MARKET IS FINALLY SEEING MORE BARRELS
Brent is down sharply near $102 and WTI near $89.
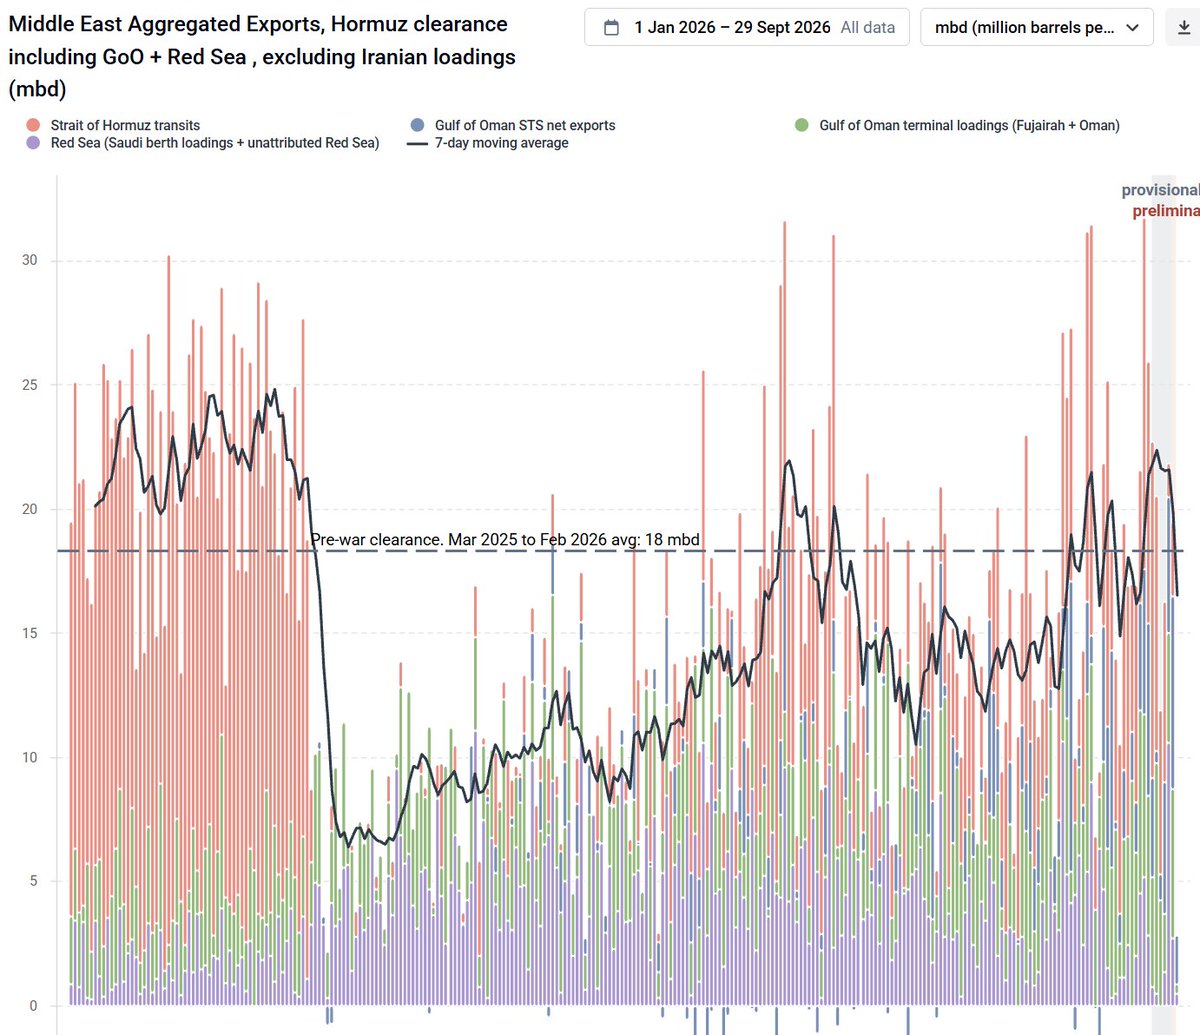
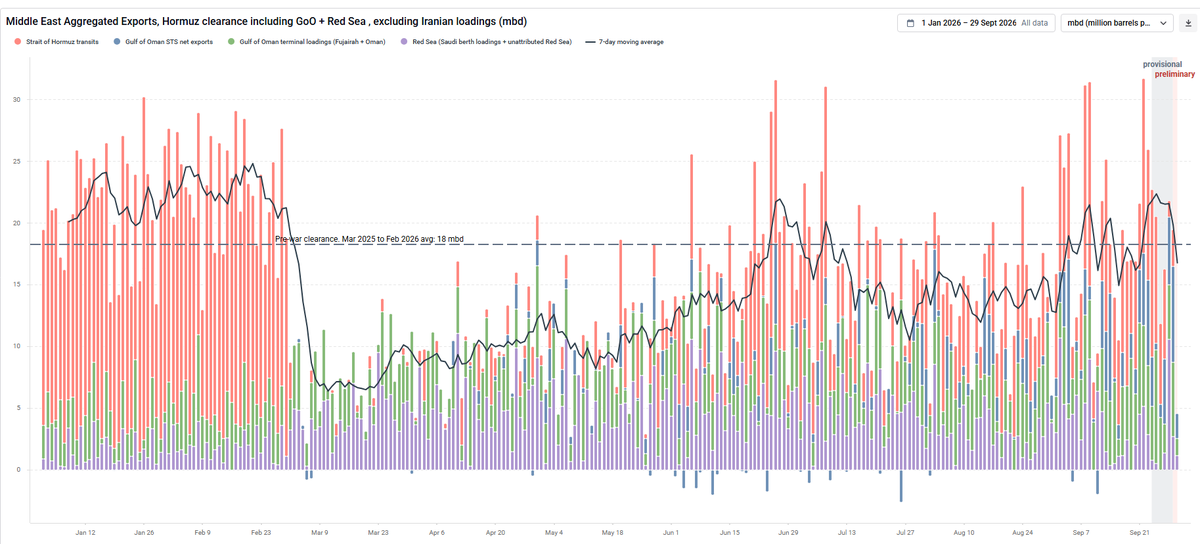
The Kpler chart explains why.
For months, the oil story was about barrels being trapped, rerouted or lost.
Now, suddenly, the direction is reversing.
📈 West Asian export flows have surged from the March lows of roughly 6–7 mbpd to the low-20s on a 7-day basis.
🇸🇦 Saudi Arabia’s East–West pipeline is moving again.
⚓ Yanbu loadings have restarted.
🚢 Hormuz traffic has improved.
🤝 US–Iran diplomatic channels remain alive.
And now comes another hammer:
🇺🇸 The US has offered to loan up to 40 MILLION BARRELS from the Strategic Petroleum Reserve.
So crude is being hit from BOTH sides:
MORE PHYSICAL BARRELS
+
MORE EMERGENCY BARRELS
That is why the risk premium is collapsing so quickly.
But don’t declare the crisis over just yet. 👇
⚠️ The Kpler chart excludes Iranian loadings.
⚠️ Iran’s normal exports of roughly 2 mbpd are still largely missing.
⚠️ The latest flow spike is a 7-day number and still provisional.
⚠️ Most importantly, the real squeeze is increasingly in PRODUCTS — diesel, jet fuel and LPG — not just crude.
Bypass pipelines can move crude.
They cannot magically create refining capacity.
That is why diesel can remain painfully expensive even while Brent falls.
🔥 THE NEXT QUESTION IS SIMPLE:
Can Gulf flows HOLD around current levels through October?
If YES:
📉 The crude shortage is effectively neutralised and oil can stay under pressure.
If flows fall back into the low-to-mid teens:
🚀 The geopolitical premium can rebuild very quickly.
And watch one more thing:
🇺🇸 SPR stocks are already near multi-decade lows.
So the US is using strategic reserves again precisely when the system remains fragile.
For crude traders, this is now less about headlines and more about FOUR numbers:
📊 Gulf export flows
⛽ Diesel inventories
🇮🇷 Iranian barrels
🏦 Actual SPR uptake
Bottom line:
🛢️ CRUDE TIGHTNESS IS EASING.
⛽ PRODUCT TIGHTNESS IS NOT.
That distinction will decide whether this is the start of a deeper oil correction — or just another violent shakeout before the next squeeze.
#CrudeOil #Brent #WTI #Oil #OilPrices #EnergyMarkets #CommodityTrading #Commodities #Hormuz #SaudiArabia #Iran #SPR #Diesel #Refining #EnergySecurity #GlobalMacro #Geopolitics #USDINR #Rupee #Inflation
🚨🛢️ OIL SELLOFF: THE MARKET IS FINALLY SEEING MORE BARRELS
Brent is down sharply near $102 and WTI near $89.
The Kpler chart explains why.
For months, the oil story was about barrels being trapped, rerouted or lost.
Now, suddenly, the direction is reversing.
📈 West Asian export flows have surged from the March lows of roughly 6–7 mbpd to the low-20s on a 7-day basis.
🇸🇦 Saudi Arabia’s East–West pipeline is moving again.
⚓ Yanbu loadings have restarted.
🚢 Hormuz traffic has improved.
🤝 US–Iran diplomatic channels remain alive.
And now comes another hammer:
🇺🇸 The US has offered to loan up to 40 MILLION BARRELS from the Strategic Petroleum Reserve.
So crude is being hit from BOTH sides:
MORE PHYSICAL BARRELS
+
MORE EMERGENCY BARRELS
That is why the risk premium is collapsing so quickly.
But don’t declare the crisis over just yet. 👇
⚠️ The Kpler chart excludes Iranian loadings.
⚠️ Iran’s normal exports of roughly 2 mbpd are still largely missing.
⚠️ The latest flow spike is a 7-day number and still provisional.
⚠️ Most importantly, the real squeeze is increasingly in PRODUCTS — diesel, jet fuel and LPG — not just crude.
Bypass pipelines can move crude.
They cannot magically create refining capacity.
That is why diesel can remain painfully expensive even while Brent falls.
🔥 THE NEXT QUESTION IS SIMPLE:
Can Gulf flows HOLD around current levels through October?
If YES:
📉 The crude shortage is effectively neutralised and oil can stay under pressure.
If flows fall back into the low-to-mid teens:
🚀 The geopolitical premium can rebuild very quickly.
And watch one more thing:
🇺🇸 SPR stocks are already near multi-decade lows.
So the US is using strategic reserves again precisely when the system remains fragile.
For crude traders, this is now less about headlines and more about FOUR numbers:
📊 Gulf export flows
⛽ Diesel inventories
🇮🇷 Iranian barrels
🏦 Actual SPR uptake
Bottom line:
🛢️ CRUDE TIGHTNESS IS EASING.
⛽ PRODUCT TIGHTNESS IS NOT.
That distinction will decide whether this is the start of a deeper oil correction — or just another violent shakeout before the next squeeze.
#CrudeOil #Brent #WTI #Oil #OilPrices #EnergyMarkets #CommodityTrading #Commodities #Hormuz #SaudiArabia #Iran #SPR #Diesel #Refining #EnergySecurity #GlobalMacro #Geopolitics #USDINR #Rupee #Inflation
The Kpler team has done everyone an immense service: there is now a dedicated dashboard that tracks total liquids out of MENA.
Means no more laborious data scraping to account for dark transits, STS, and other ephemera.
Oh, and Kpler team is pretty conclusive: regional flows back to near-prewar levels.
Free newsletter: When will the AI bubble burst? When the money runs out. Raising debt for AI data centers is becoming untenable, infrastructure break-even points keep getting further away, and many of VC's AI investments look like dead money.
https://t.co/QzmqTaS2eM
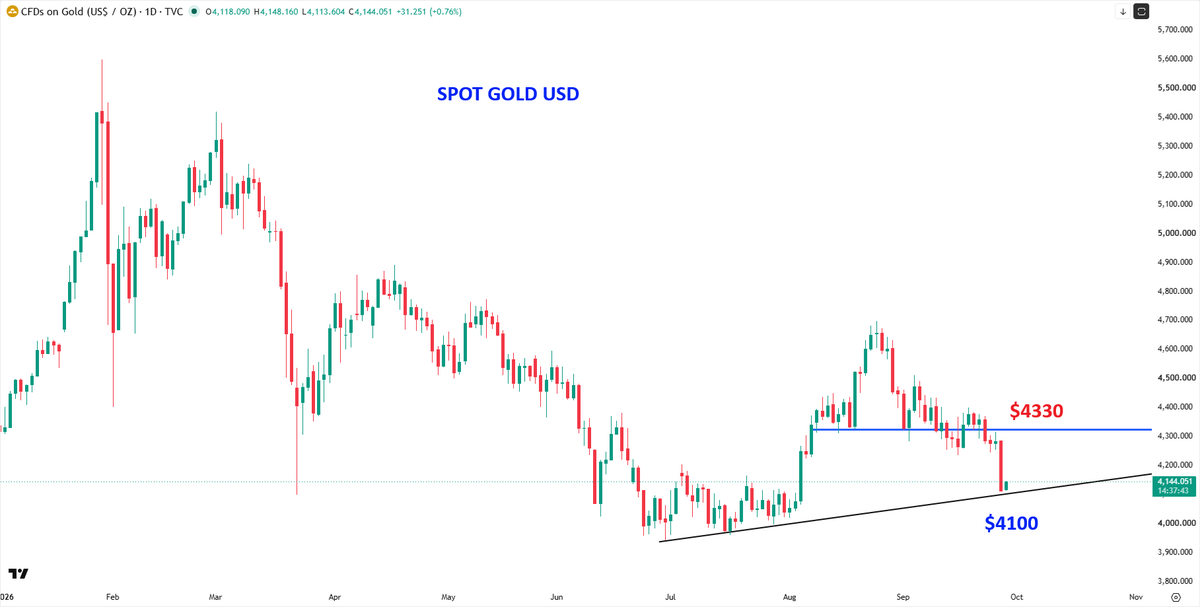
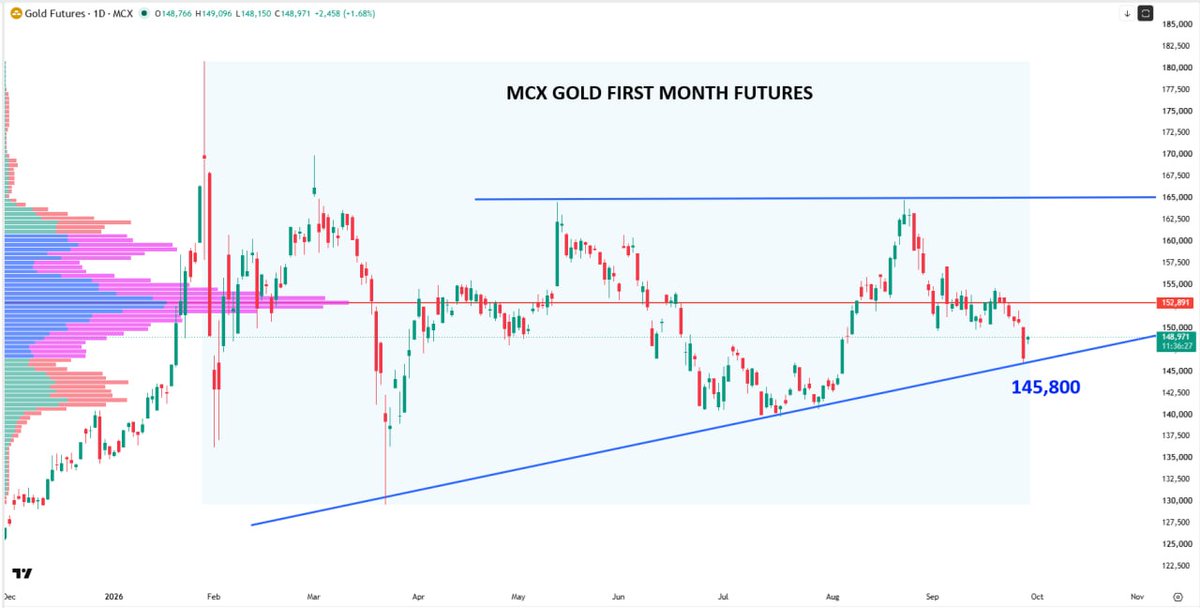
🥇🔥 GOLD AT A MAJOR INFLECTION POINT — SPOT & MCX TELLING THE SAME STORY
Gold has arrived at one of the most important technical zones of this entire correction. Both international Spot Gold and MCX Gold are testing long-duration, relatively flat rising trendlines. That matters because the flatter and longer the trendline, the more meaningful the support tends to become — it reflects a broader structural base rather than a short-term momentum trend. In other words, this is not just another support level. This is where the larger bullish structure gets tested.
🌍 Spot Gold is sitting around the $4,100–4,120 trendline zone. As long as this area holds, the broader bullish structure remains intact. For existing positional longs, the beauty of the setup is the very small and clearly defined risk — a sustained break below $4,080 would invalidate the immediate bullish thesis. On the upside, $4,330 is the first major hurdle. A sustained reclaim of $4,330 would strongly suggest that the recent fall was a correction into structural support, opening the way towards $4,450–4,500 and potentially $4,600–4,650 thereafter.
🇮🇳 MCX Gold is showing almost the same structure. The corresponding rising trendline is sitting around ₹145,800–146,000, making this the key positional support zone. As long as MCX Gold holds above this band, bulls retain the larger structural advantage. A break below roughly ₹145,000–145,500 would weaken the setup materially. On the upside, ₹152,900–153,000 is the immediate resistance zone, while ₹164,500–165,000 remains the larger breakout barrier. A decisive move above ₹165,000 would signal that the broader consolidation is ending and could potentially trigger a fresh leg of the long-term bull market.
The key takeaway is simple: Gold is attractive here not because it has to rally, but because the risk-reward has become extremely clean. The market is sitting almost exactly on the line that tells us whether the bullish thesis survives or fails. Spot holds $4,100 and MCX holds ₹145,800–146,000 — bulls remain alive. Spot breaks $4,080 and MCX breaks ₹145,000–145,500 — respect the breakdown.
🔥 This is the battlefield. This is the inflection point. This is where Gold decides whether the correction ends… or deepens.
#Gold #XAUUSD #MCXGold #GoldPrice #Bullion #PreciousMetals #CommodityTrading #TechnicalAnalysis #GoldTrading #Commodities #MarketAnalysis #TradingSetup #MacroTrading #GoldBull #IndianMarkets
🚨BREAKING: OpenAI just cut the $200 Pro subscription plan's compute allocation by 50%
"In effect, if you do the math, it will net out at half the dollar in API spend compared to the old Pro $200 plan"
it’s unbelievably over
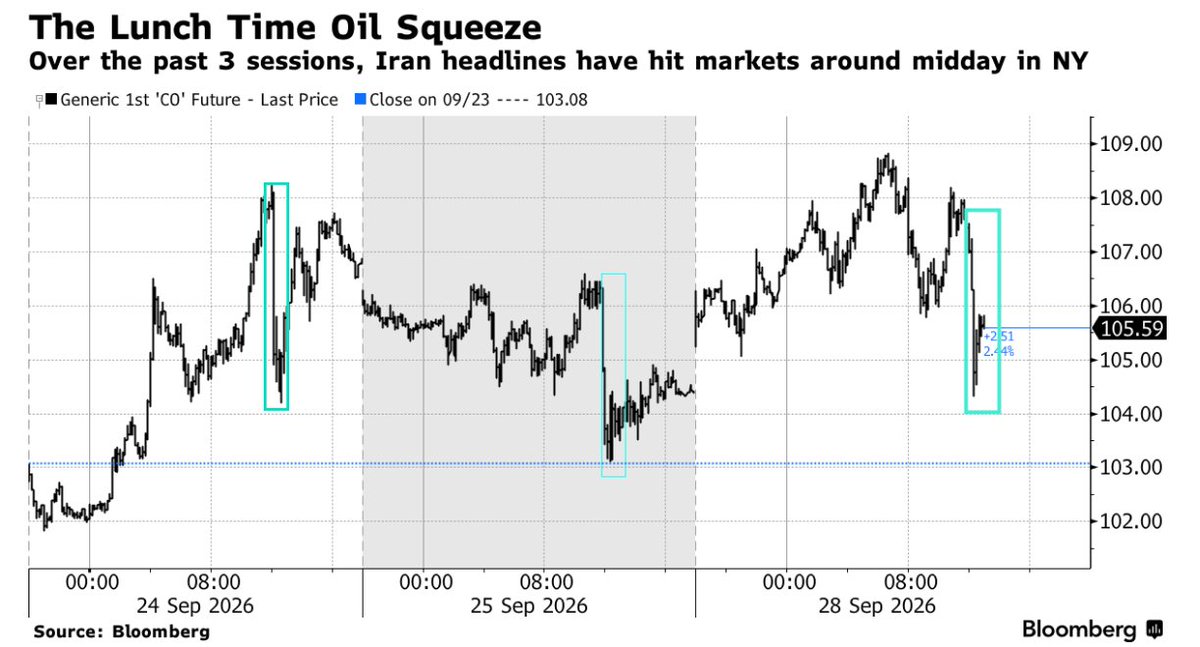
Everyone is noticing. Here's Bloomberg:
"The past couple of sessions have seen a resurgence in the ‘VaR Shock’ strategy on oil, with headlines emerging right around midday ET, when liquidity tends to thin during US hours. As rates push higher along with oil, the $110 level on Brent level is a threshold of concern for escape velocity, but the verbal jawboning is showing signs of decay. Following a report that the US administration is willing to reconsider a waiving of Iran sanctions and unfreezing of assets in reopening discussions on the nuclear issue, the Iran side rebuffed the headlines almost immediately, putting a floor on the kneejerk reaction lower in crude. This strategy could indeed keep oil players on their toes, especially at current elevated positioning levels (despite being off the highs). The nefarious feedback loop between oil and rates is way too potent at the moment for the momentum higher to break on mere headlines. "
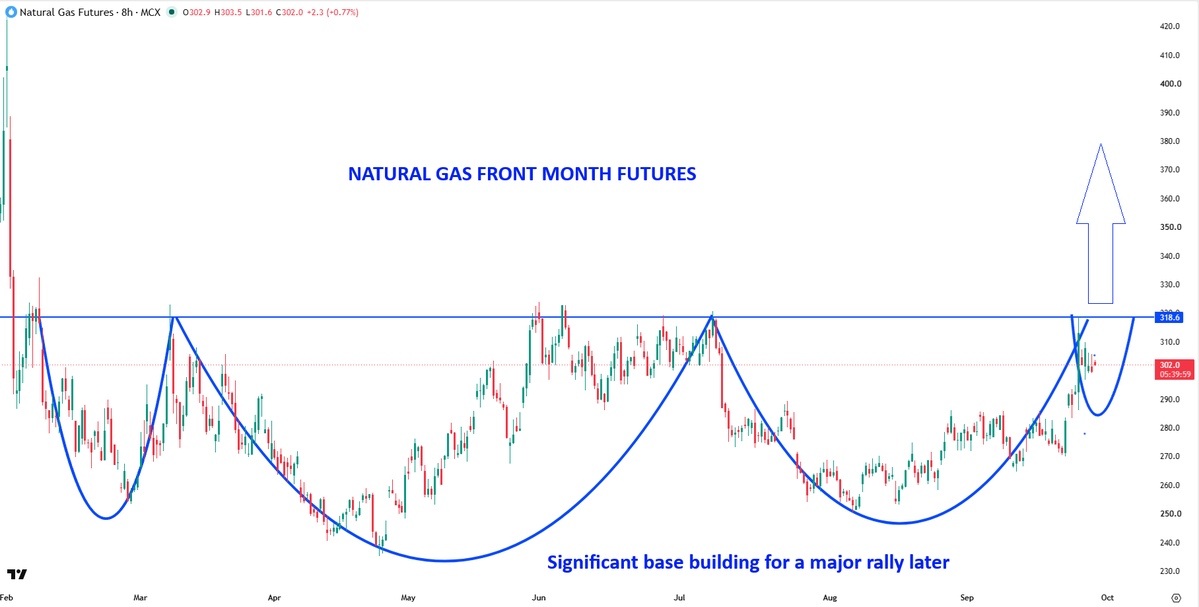
🔥 MCX NATURAL GAS: MONTHS OF BASE BUILDING. ₹320 HOLDS THE KEY.
Natural gas is developing a compelling bullish structure. Repeated recoveries towards ₹318–320, combined with the higher August low, suggest buyers are rebuilding strength after the earlier correction. The latest advance towards ₹302 brings that major ceiling back into focus.
📈 A sustained breakout above ₹320 would mark a significant shift: a resistance zone that has capped prices for months could become the foundation for the next advance. That would bring ₹344–350 into focus initially, followed by a broader measured objective near ₹380–390.
A pause or pullback before the breakout would not undermine the setup by itself. Holding ₹285–290 would preserve the immediate recovery structure; ₹270–275 remains the deeper support that bulls need to defend.
🛡️ Our bias is bullish. The opportunity lies in the size of the developing base—but conviction should increase when ₹320 is cleared and held. Define the stop first, then size the position.
#NaturalGas #MCXNaturalGas #NatGas #MCX #EnergyMarkets #Commodities #CommodityTrading #TechnicalAnalysis #PriceAction #BreakoutTrading #ChartPatterns #FuturesTrading #SwingTrading #PositionalTrading #RiskManagement
🔥 MCX NATURAL GAS: MONTHS OF BASE BUILDING. ₹320 HOLDS THE KEY.
Natural gas is developing a compelling bullish structure. Repeated recoveries towards ₹318–320, combined with the higher August low, suggest buyers are rebuilding strength after the earlier correction. The latest advance towards ₹302 brings that major ceiling back into focus.
📈 A sustained breakout above ₹320 would mark a significant shift: a resistance zone that has capped prices for months could become the foundation for the next advance. That would bring ₹344–350 into focus initially, followed by a broader measured objective near ₹380–390.
A pause or pullback before the breakout would not undermine the setup by itself. Holding ₹285–290 would preserve the immediate recovery structure; ₹270–275 remains the deeper support that bulls need to defend.
🛡️ Our bias is bullish. The opportunity lies in the size of the developing base—but conviction should increase when ₹320 is cleared and held. Define the stop first, then size the position.
#NaturalGas #MCXNaturalGas #NatGas #MCX #EnergyMarkets #Commodities #CommodityTrading #TechnicalAnalysis #PriceAction #BreakoutTrading #ChartPatterns #FuturesTrading #SwingTrading #PositionalTrading #RiskManagement