Anthropologist and PhD in Economics.
Data enthusiast, #rstats.
I am an agnostic, dyslexic, insomniac. I lay awake all night wondering if there is a dog.
{codehover} is a new R package I just created!! It's educational: in a HTML page you pass the mouse on the code that you made and it should show the intermediary results. It should go hand in hand with pipes (the old and/or the new). (#RStats )
spopt, an R package for spatial optimization, is now in general release on CRAN.
spopt-r is inspired by the Python package of the same name. Features include:
- Regionalization algorithms for building contiguous districts / territories;
- Facility location solvers;
- Route and fleet optimization solvers;
- Optimized corridor routing on cost rasters;
- The classic Huff model for market analysis;
- Pathways for using open-source routing engines like R5 and OSRM.
Solvers are written in C++ and Rust so they run fast.
Get started: https://t.co/uQQNIaTIv7
O provincianismo é uma praga. Enquanto não soubermos discutir os grandes temas federativos sob uma perspectiva de nação, além do “nosso umbigo”, não vamos a lugar nenhum. No caso dos royalties, chega a ser indecoroso “alguém” ainda defender modelo atual por favorecer seu estado.
A Frente Parlamentar da Agropecuária quer "curar" o paciente ao quebrar o termómetro ao proibir que bancos utilizem o desmatamento detectado pelo PRODES por meio de imagens de satélite. https://t.co/TYvplveFof
Mentira, Deltan. Menos de 24h depois do ex-procurador de Curitiba postar esse vídeo oportunista, reportagem da BBC com dados obtidos por meio da LAI mostram que “fuga” de milionários não cresceu 50% e, em proporção do número de pessoas nessa faixa de renda, até caiu desde 2017.+
📈Thanks everyone for the amazing response to my first post!
I've uploaded the second stats lab with R for beginners on my webpage.
The topic is "What Does It Mean to “Control” in Regression Analysis?"
https://t.co/PS4vF6dg4x
#rstats#econ#stats#statistics#data
Juntei alguns materiais que tinha e montei um e-book sobre Sistemas de Informação em Saúde no Brasil
https://t.co/cuzdZtiAmX
Além de uma introdução, apresento detalhes sobre 8 sistemas de informação, 2 sistemas de vigilância epidemiológica e outros detalhes.
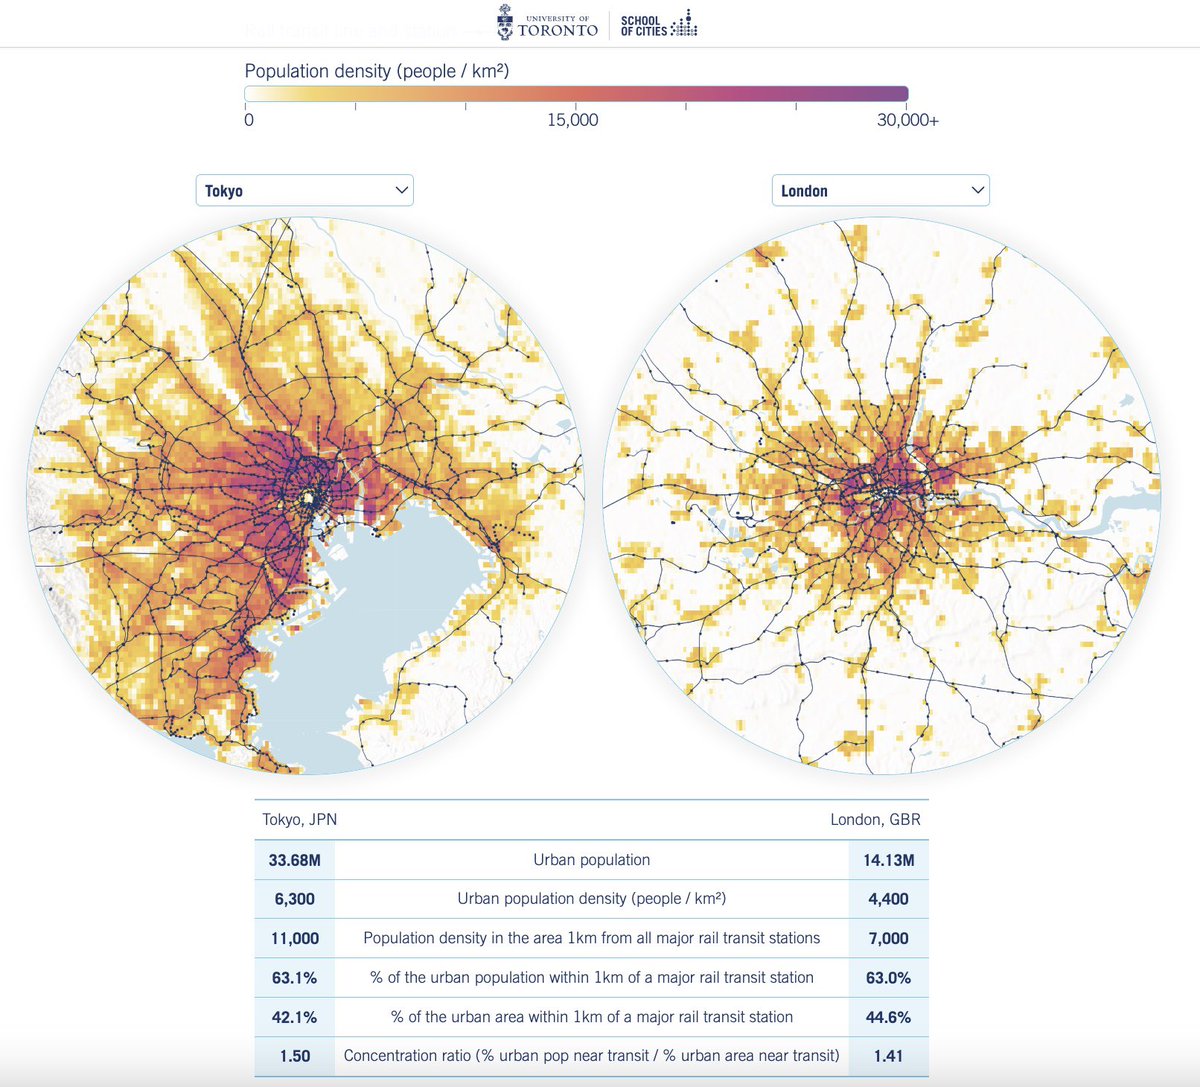
Calling all map/urban/railway nerds to check out this website visualising railway accessibility across 250 cities around the globe - awesome #cartography and #dataviz ❤️
🔗 https://t.co/6MOv0mWO0R