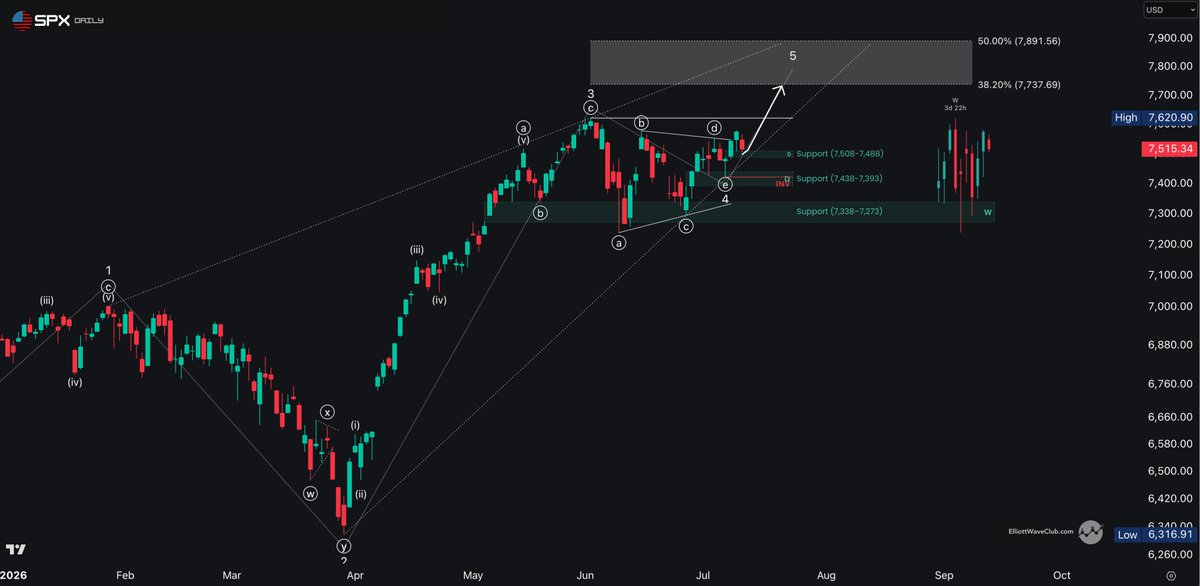
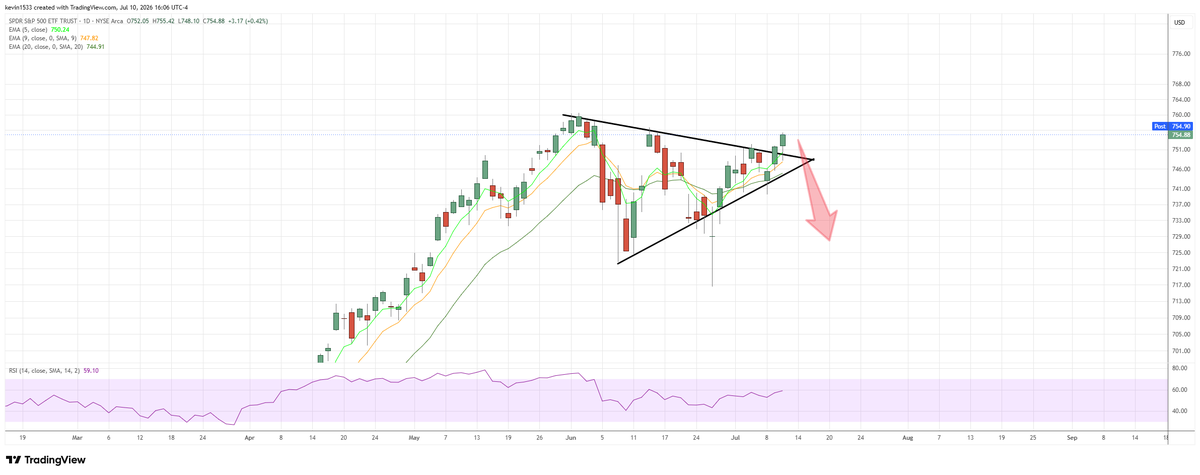
$SPX cleared the triangle's B-wave high, then pulled back.
A new bullish Daily FVG formed at 7508–7488 — and price just tapped it.
This is the shallow pullback the setup wanted. Support doing its job.
Lean: resolves higher. CPI is the catalyst.
7620 all-time high is the path of least resistance → 7700–7800 the measured move.
Below the triangle low at 7422, this invalidates.
🚨 Trump just put 1000 missiles on Iran.
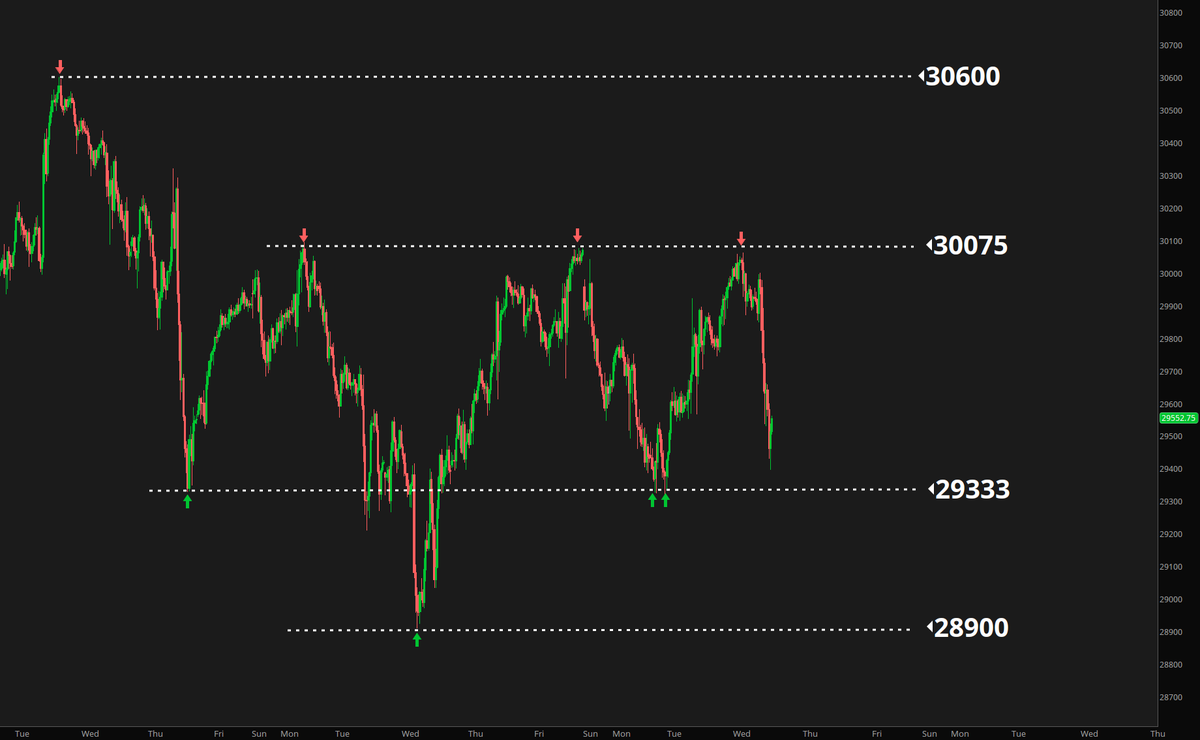
retail dip buyers are spending the weekend looking at futures and queuing up orders to scalp the monday open.
zoom in on that red circle. when a kinetic shock actually hits, market makers pull the bids entirely. that carefully placed stop loss you rely on becomes a market order puking into a vacuum.
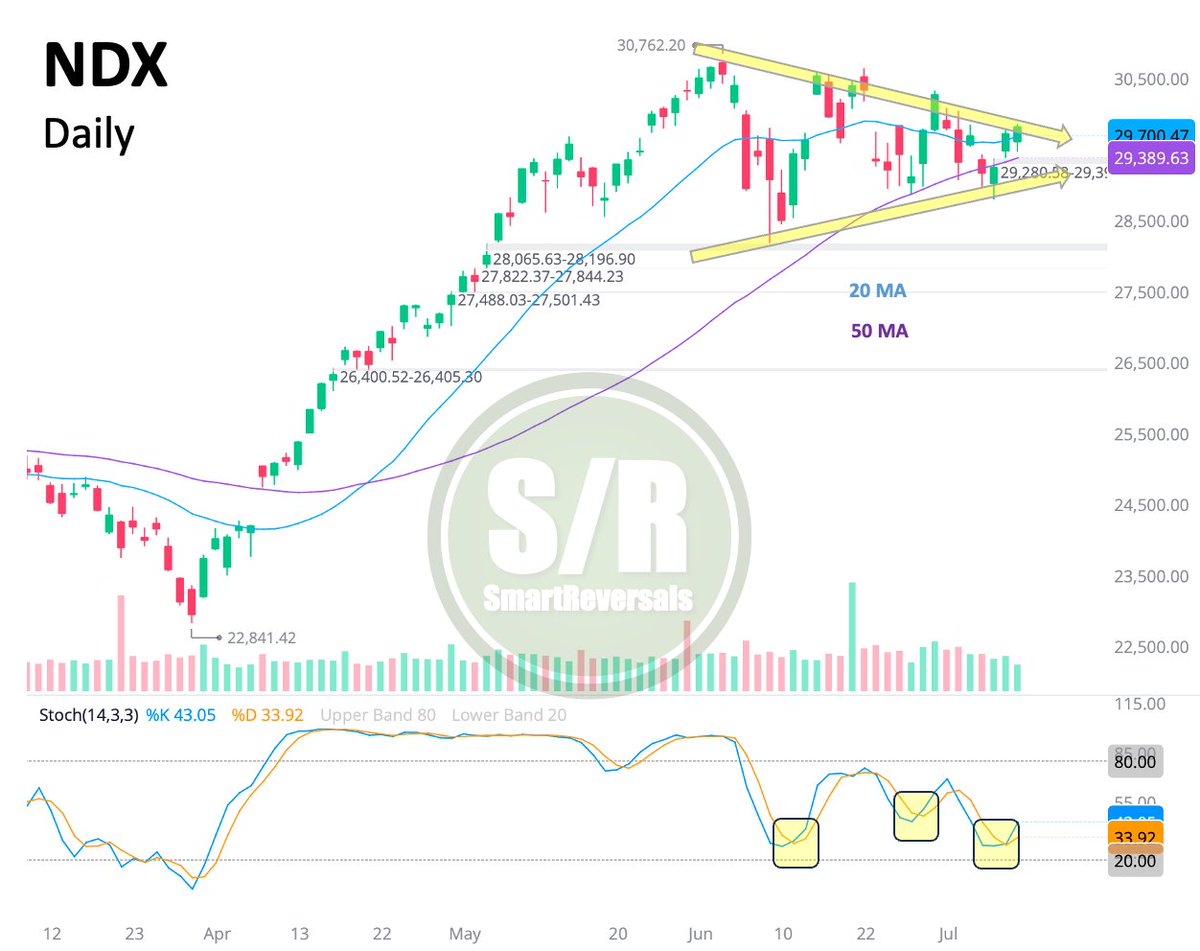
$NDX: Price action is narrowing, anticipating a big move is coming. Don't fight the bullish move, but beware the gap below, -1.8% from the latest closing price.
Bulls want a gap fill for good, the next hurdle is 30,180.
Recap of the weekly plan for $SPX:
1) The bullish bias for the week was correct, and we got a test of the 7540–45 zone.
2) That 7540–45 resistance area produced a nice pullback on Monday. Price dropped 130 points precisely from that level (without exceeding it by more than 5 points), as shown in the screenshot.
3) The 7420 weekly support held to the tick on Wednesday and produced a 160-point rally into Friday, as shown in the screenshot.
It was a perfect week. The TA levels couldn’t have been more precise.
I’ll post the weekly plan for next week over the weekend.
Have a great weekend, everyone.
$SPX broke out of its bull flag, but volume remained light, increasing the risk this breakout turns into a fakeout.
Potential multiple catalyst on deck next few weeks to test this.
🚨 SPX IS FOLLOWING THE SAME VOLUME SCRIPT AGAIN
Six months ago I mapped a three-phase sequence
Low volume rally, volume picks up, then high volume sell-off
The first phase played out perfectly
Right now we're halfway through phase two
Volume is picking up exactly where it should
And something else just appeared at the top that makes me even more confident in what comes next
A bearish diamond pattern formed at the highs
One of the rarest reversal signals on the chart
Phase three is the only part of this sequence that nobody's ready for
Don't worry, I'll warn you in advance
🚨 NOBODY IS TALKING ABOUT THIS!
Based on my $SPX chart, here's my 2026-2027 plan:
1. Pullback to 7,250 → rally to 7,800
2. Creek formation → 2-3 months of downside
3. Drop to 6,150 + Spring formation
4. Recovery phase → rally toward 8,300 by late 2027
Don’t be exit liquidity - turn on notifs, I’ll update
🚨 S&P 500 IS BEING MANIPULATED, AND HERE'S WHY
The market is moving higher on dead volume.
No real buyers.
No real demand.
Just algos pushing price up while retail gets baited back in.
This is a manufactured pump before the real volume returns.
And when real volume comes back, it won't be buyers.
It'll be sellers.
Classic bull trap.
Strong markets gap down, recover & close higher. Weakening markets gap up, fade & close lower. SPX has gapped up & faded on the two most bullish days of the year. Chart from @RachelDashCS