Ran a few small-capacity edges over the past 10 days for fun: +23–70% return on capital individually, good for a +53% blended return across 344 trades / bets. 4.5-6.6 individual strategy sharpes for a blend of ~10.
Capacity doesn't move the needle for me, but I repeat - if you have a small bankroll, stop trying to out-predict Jane Street on NVDA earnings.
A look back at the stocks that traded above 10x sales at the dot-com peak.
What happened next:
– Cisco: ~25x sales, P/E above 200. Crashed -90%. Finally broke its 2000 peak in December 2025. 25 years and 8 months later.
– Intel: ~13x sales. Crashed -82%. Finally broke its 2000 peak in May 2026. Almost exactly 26 years later.
– Microsoft: ~25x sales. Crashed -65%. Took 16 years and 8 months to make a new high (October 2016).
– Qualcomm: ~30x sales. Crashed -88%. Took roughly 20 years to break even.
– Sun Microsystems: ~10x sales. Crashed -97%. Acquired by Oracle in 2009.
– JDSU: ~50x sales. Crashed -99%. Broken into pieces.
– Yahoo: ~50x sales. Crashed -97%. Sold to Verizon for a fraction.
– Lucent: ~10x sales. Crashed -99%. Eventually absorbed by Nokia.
– Nortel: ~15x sales. Bankrupt in 2009.
Then there's the famous mega survivor.
Amazon traded at ~30x sales at the peak. It still crashed -97%. The investor who bought at the top held through a 97% drawdown before eventually making money roughly a decade later.
The lesson isn't that every 10x sales stock ends in zero.
It's that even the eventual winners crash 90%+ first, and break even only after a generation.
Cisco. Intel. Microsoft. Amazon. The four greatest tech survivors of the dot-com era. Average time to break even on price alone: roughly 19 years. Inflation-adjusted, the math is uglier.
You have to be very right, very early, and willing to hold through unimaginable pain.
Most people aren't.
First 100 accounts to signup at https://t.co/td7bSBj749 🔒
Get LIFETIME access to the only indicator that has perfectly timed every BTC top + bottom since 2011
#Bitcoin AO 📍 Alpha α Omega Ω Cycle Indicator
Repost ♻️ for a chance to get it free
$500,000 is the number
Once you have that much in a brokerage you can product $7,500-$10,000 a month in option income.
Thats taking into account 2-4 trades a month at low deltas & minimal effort.
Then life goes on easy mode.
In case you missed it.. this insane 102% OTM $VIX call came in for a total of $14.7M today
Came in after we saw millions pouring into $SPY bearish flow as well as millions into $GLD bullish flow
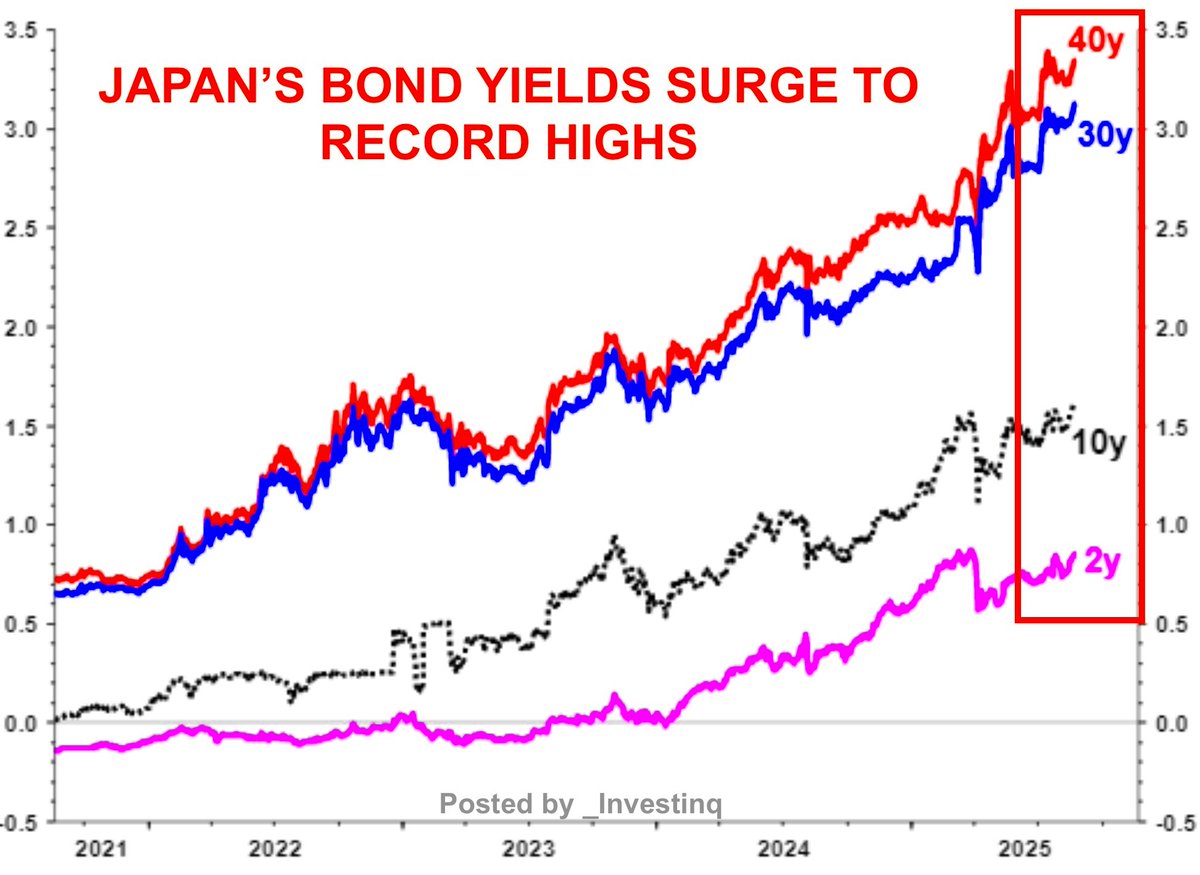
🚨 Japan’s long-term yields are going vertical.
Yields on 10Y, 20Y, 30Y, and 40Y JGBs are soaring to multi-decade highs.
This could reshape global capital flows and slam U.S. Treasuries.
(a thread)
🚨 Margin debt just hit a fresh all-time high: $1.022 trillion.
The market is on fire, but so is the leverage behind it.
This is one of the most dangerous signals in the markets right now.
( a thread)
🚨📉 Massive $SPX Bearish Flow Alert
Right before the drop on $SPX, an $11,000,000+ surge in bearish puts hit the tape—now the underlying is down over 10+ points. Big money knew. 👀
China escaped socialist poverty and enjoyed unprecedented growth when it implemented capitalist principles. Now private entrepreneurialism fueling the economic rise has come to a full stop, and China returns to state run economy. All state run economies in history failed badly.
The S&P 500’s path this year echoes 2000: a euphoric tech-driven rally, a spring correction, then a summer retest - before a major plunge (Chart).
Back in 2000, the index double-topped in March and July before diving in H2 2000 as profits plunged.
Yes, today’s July high edged past the March peak - but the broader setup is eerily familiar (Chart).
Buckle up!
If you aren't using Styles on thinkorswim or Templates on TradingView, you are missing out on a KILLER feature that will save you A LOT of time.
thinkorswim: https://t.co/vGAHyUJXLo
TradingView: https://t.co/62xDDv6umZ