While there's lots of work to be done, mamp-ml is a critical advancement in plant immunology for accelerating receptor-epitope characterization and engineering resistance. Mamp-ml is on Github and on Google Colab for easy use. Please check it out! https://t.co/oQA5WXF5sB
#2025ISMPMI 📣 In silico screening of PRR-epitope interactions is now possible! Here, we developed mamp-ml to predict their immunogenic outcomes without structural context. Let's accelerate engineering plant receptors for robust resistance!🚀🌱 Small🧵
https://t.co/ki6FFBbmQ6
“For groundbreaking discoveries of the immune system and disease resistance in plants.”:
Jeffery Dangl, Jonathan Jones, and Brian Staskawicz, Wolf Prize Laureates in Agriculture 2025, have revolutionized our understanding of plant immunity and disease resistance.
Celebrate their transformative work in shaping sustainable agriculture!
@TheSainsburyLab@PMB_Berkeley@UNC_Biology @HHMINEWS
#wolfprize2025
#wolfprizelaureate #wp2025laureate #wp2025agriculture #wp2025
Very useful piece for everyone, not just for scientists.....I feared presenting my research to an audience—until I tried stand-up comedy | Science | AAAS https://t.co/jD4KCK6jEm
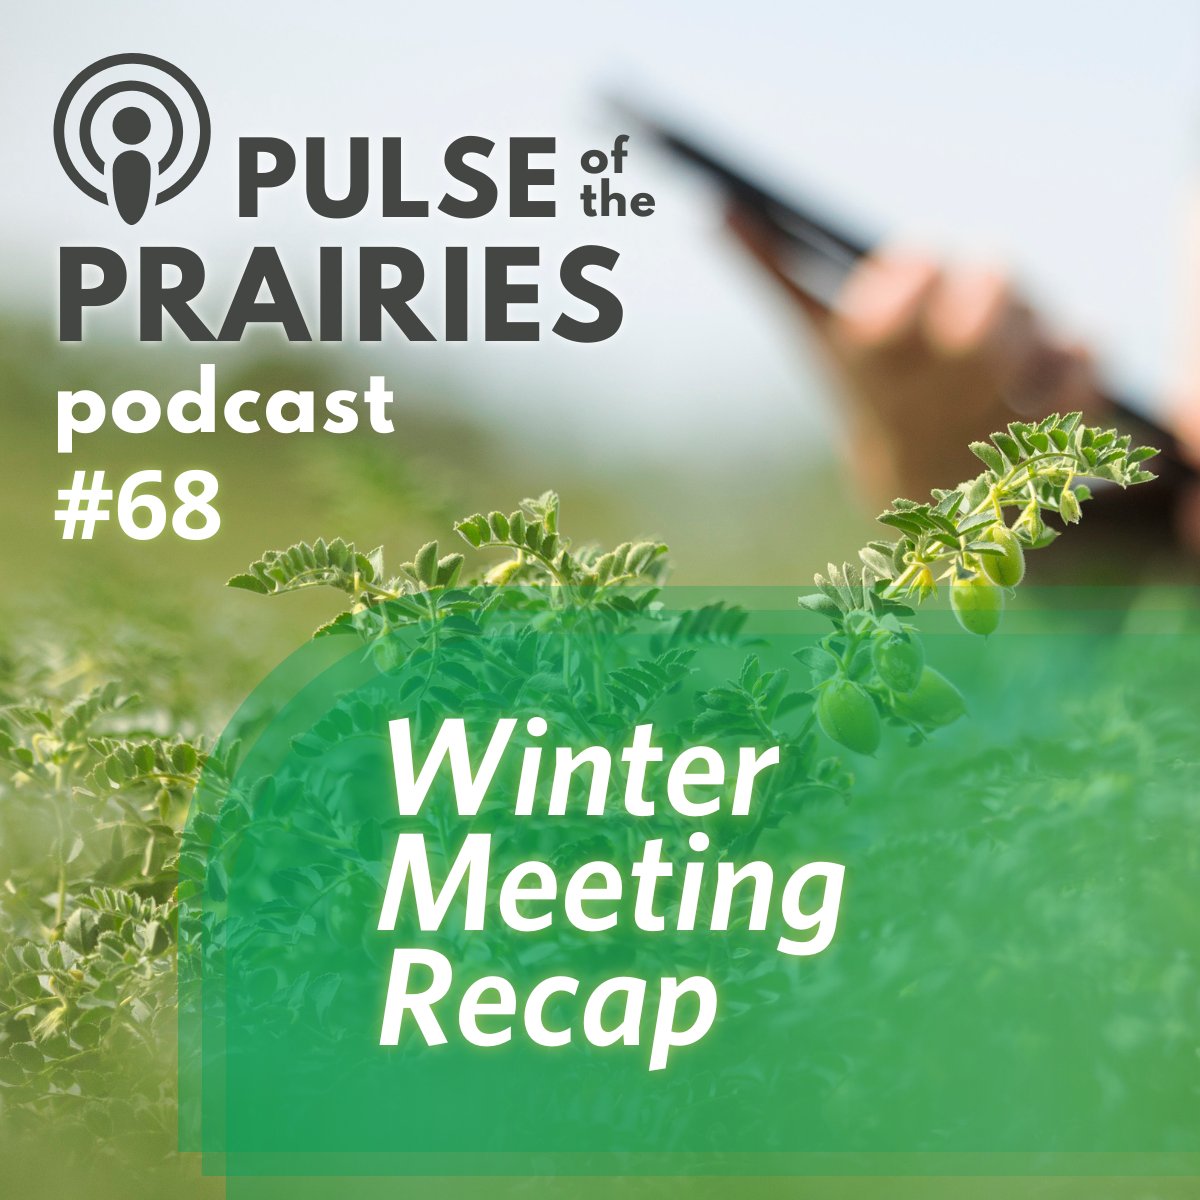
The 2025 winter pulse meetings have come to a close and we learned lots from leading industry experts on the latest developments in the pulse industry and what growers need to know. Learn more in this podcast episode: https://t.co/WJJdvp3Abb @AgronomistSPG
Having a clear plan for a data analysis and visualization project is crucial. It ensures efficient resource utilization, timely insights, and accurate interpretation of findings, leading to informed decision-making.
Here are the typical steps of a data analysis and visualization project in R programming:
1️⃣ Data Import: Gather your data into R, setting the stage for later steps.
2️⃣ Data Manipulation: Prepare your data for analysis and visualization.
3️⃣ Descriptive Statistics: Calculate key data characteristics to understand your data better.
4️⃣ Inferential Statistics: Dive deeper into your data, validate hypotheses, and make informed decisions.
5️⃣ Results Visualization: Showcase your findings with compelling visuals to communicate the impact of your analysis effectively.
Explore my webinar, where we'll dive deeper into these steps.
More details are available at this link: https://t.co/xZl4UCUpHG
#StatisticalAnalysis #Data #datasciencetraining #datastructure
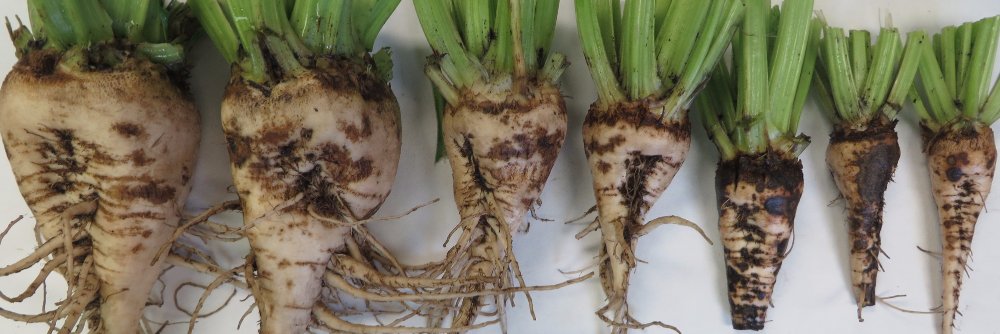
On National Real Sugar Day, we celebrate real sugar and all the people who make it possible. Here you can see sugarbeets being harvested in our Minn-Dak region this week. #NationalRealSugarDay@moretosugar
Apply TODAY for the John Innes Foundation Rotation PhD Programme 🪴
This prestigious 4-year #PhD programme trains graduate students in Plant and Microbial Sciences at the John Innes Centre and @TheSainsburyLab
Closing date - 14 November 2024
More info: https://t.co/E0SIOitxS2
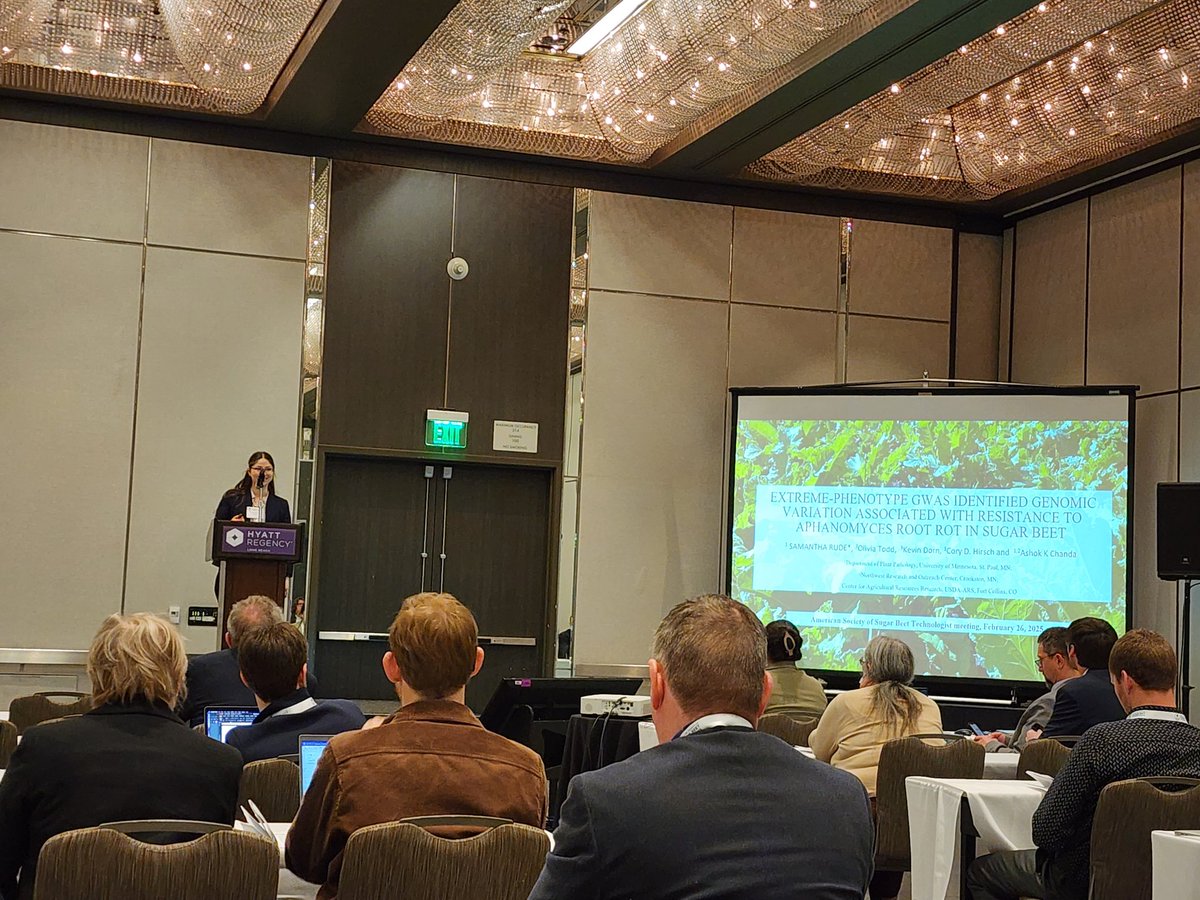
It was awesome to have on our summer team Jacob! Hope we convinced you that plant pathogens are as cool (and nasty) as human pathogens. We wish you all the best! Thanks to @TPhytopath for serving as his mentor. @UMNPlantPath @CFANS_NWROC