@JuneGoh_Sparta Your Oct comment is interesting. "Who knows but we will see how much WTI bought in July for this
arrival window." Are you suggesting Asia bought a lot of WTI and we should expect large exports from the USGC to Asia for October arrival? Or did you say WTI and mean oil? Thx June!
@_sarathtweets@Amena__Bakr "Shipments to overseas buyers from Yanbu have averaged about 4.1 million barrels a day so far in June, according to tracking data."
Incremental Red Sea exports as well as more from Fujairah matter, but your figures are way off. At best, it's up 5mbpd
https://t.co/joxc13PdR7
@tleilax___ Appreciate the post. Is using the 4 week rolling average in these particular charts the right way to look at this given how much has changed over the last 4 weeks?
@robin_j_brooks The world's biggest oil importer (China) took the "hit."
If the hit had been taken by India, your chart would show imports of 0 for May.
@BobEUnlimited Exactly. GDP masks the economic strength captured by durable goods. AI chips are designed and deployed in the US. Importing the GPU creates a math drag, but the high-value IP is US-based.
Durable goods show the real strength. GDP gives a misleading sense of weakness.
@JavierBlas China buyers strike. They're drawing >4mbpd for >100 days.
Largest inventory draw in the history of oil.
Whether they refill or not has massive implications for the forward curve.
@johnarnold In Pecos, Tx, right where the Waha hub is located, which routinely sees negative pricing for natural gas. Might as well use that associated gas for data centers.
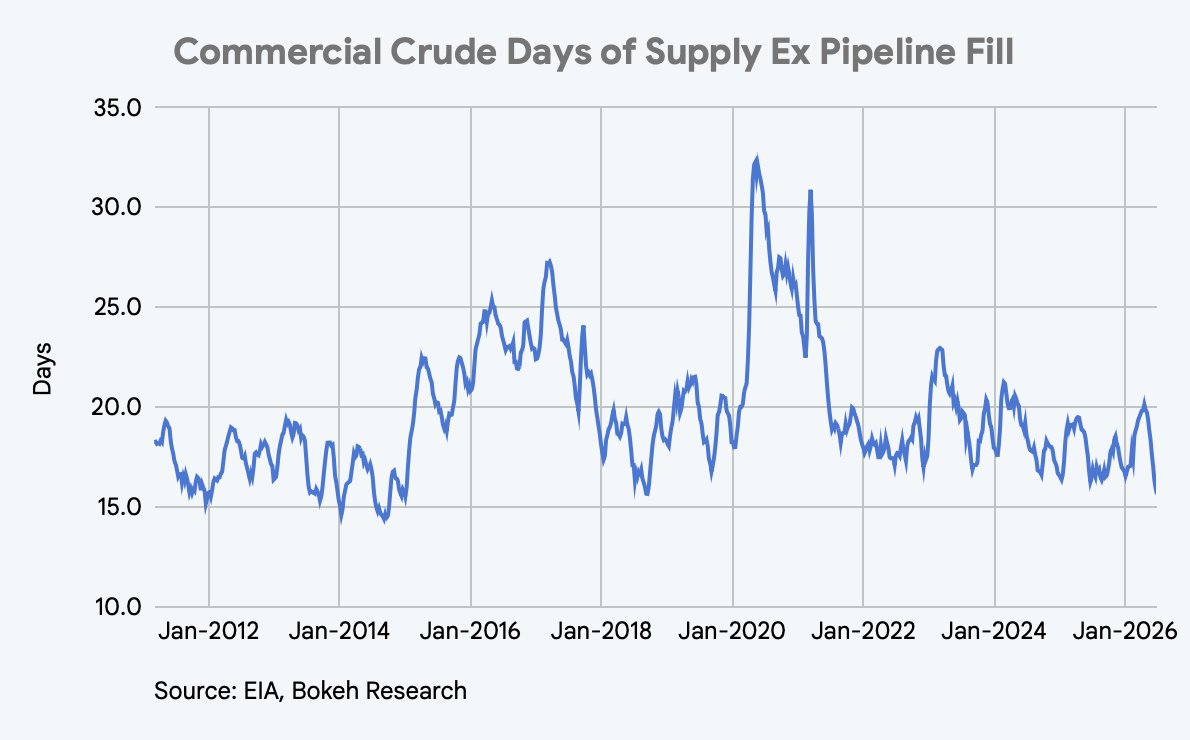
Had the 84mm barrels of SPR releases over the last 12 weeks come out of commercial inventory (hypothetical BS), Days of Supply Ex Pipeline fill would be ~11.4.
** BS because refinery runs, product supplied, & trade would all be affected **. #oott